which one of the following graph is not correct for ideal gas ?
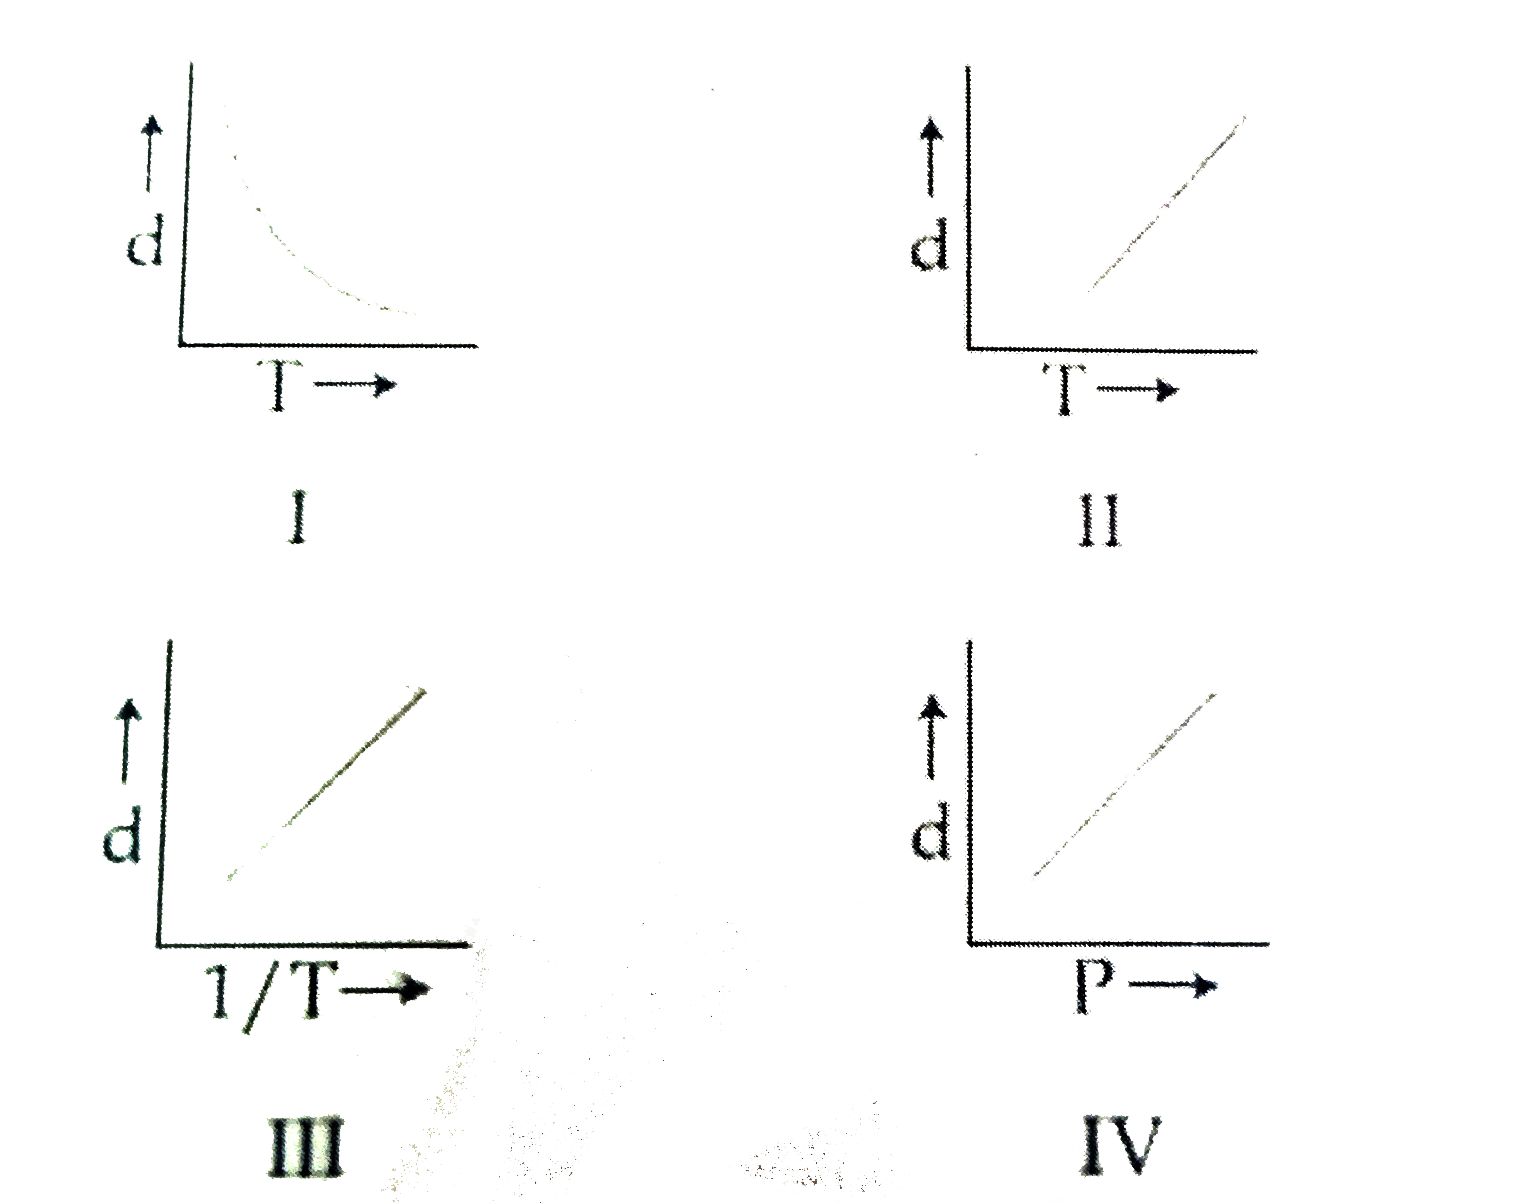
d=density ,P=pressure,T=Temperature
IV
III
I
II
Step by step video & image solution for which one of the following graph is not correct for ideal gas ? d=density ,P=pressure,T=Temperature by Chemistry experts to help you in doubts & scoring excellent marks in Class 12 exams.
Updated on:21/07/2023Topper's Solved these Questions
Similar Questions
Knowledge Check
Which of the following graphs represent the behaviour of an ideal gas ?
A1.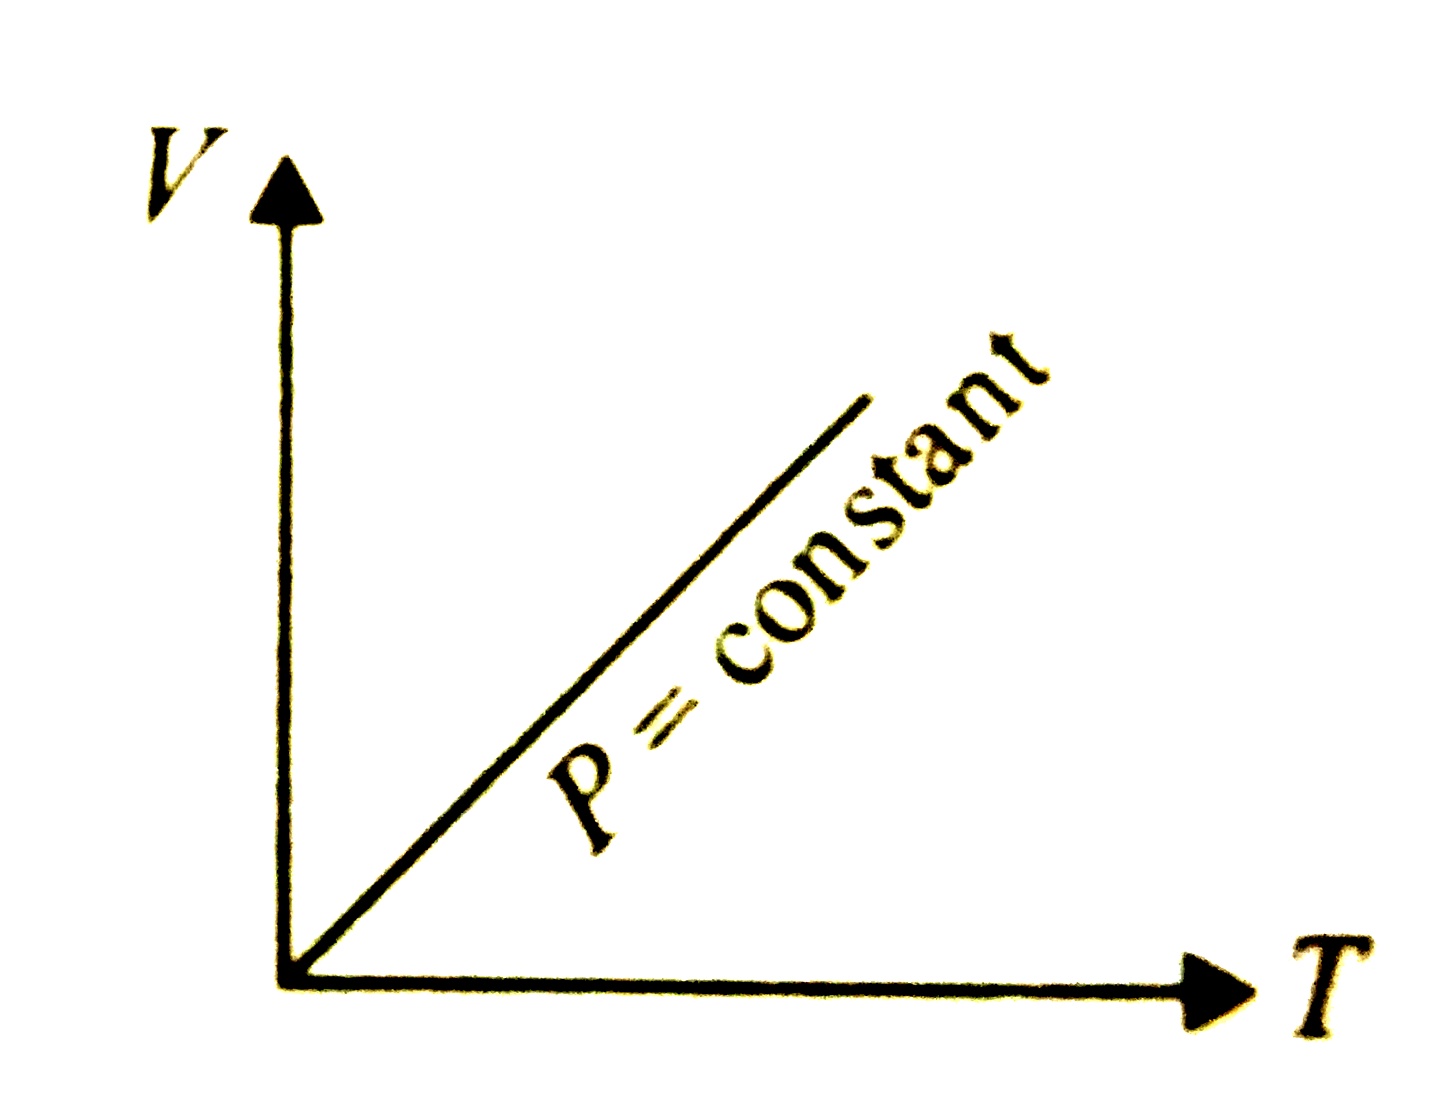 B2.
B2.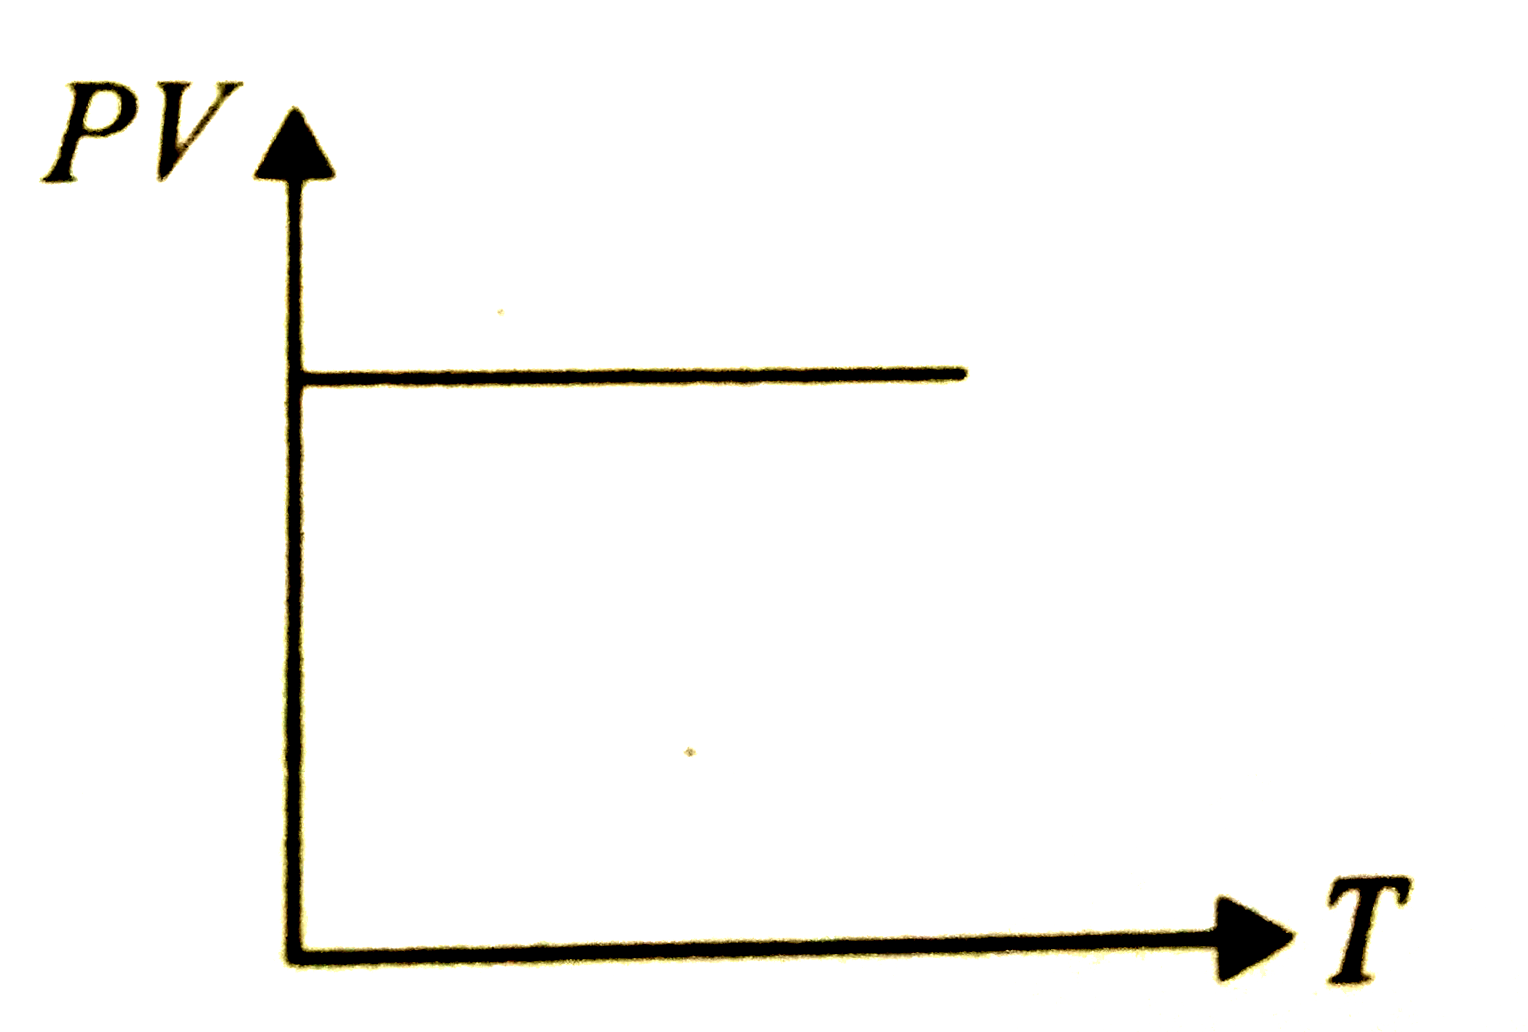 C3.
C3.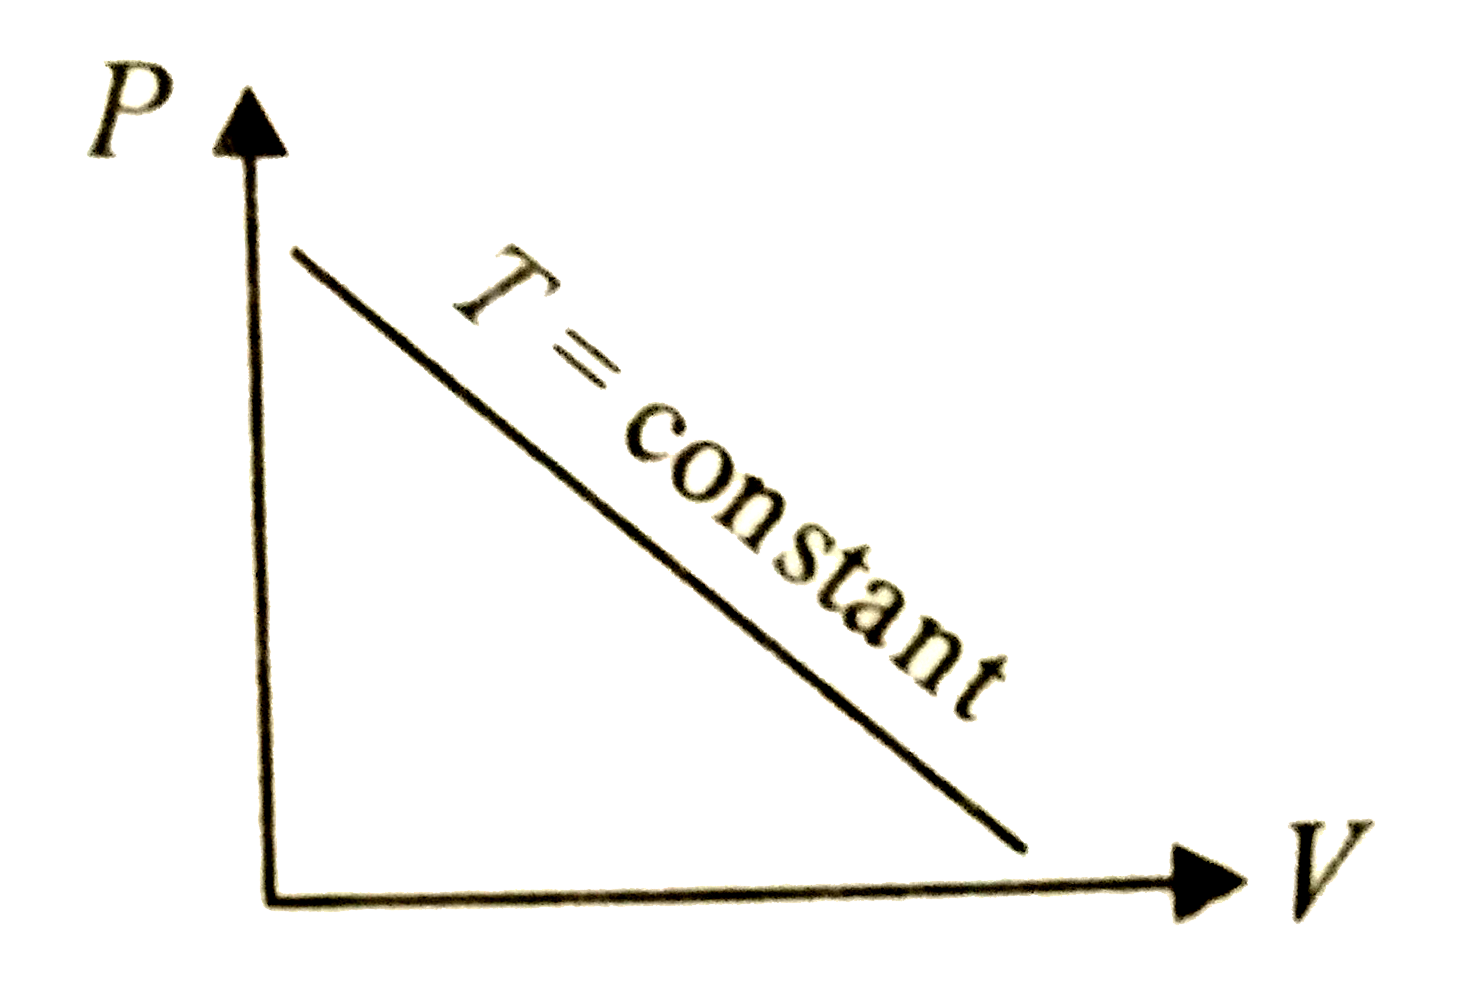 D4.
D4.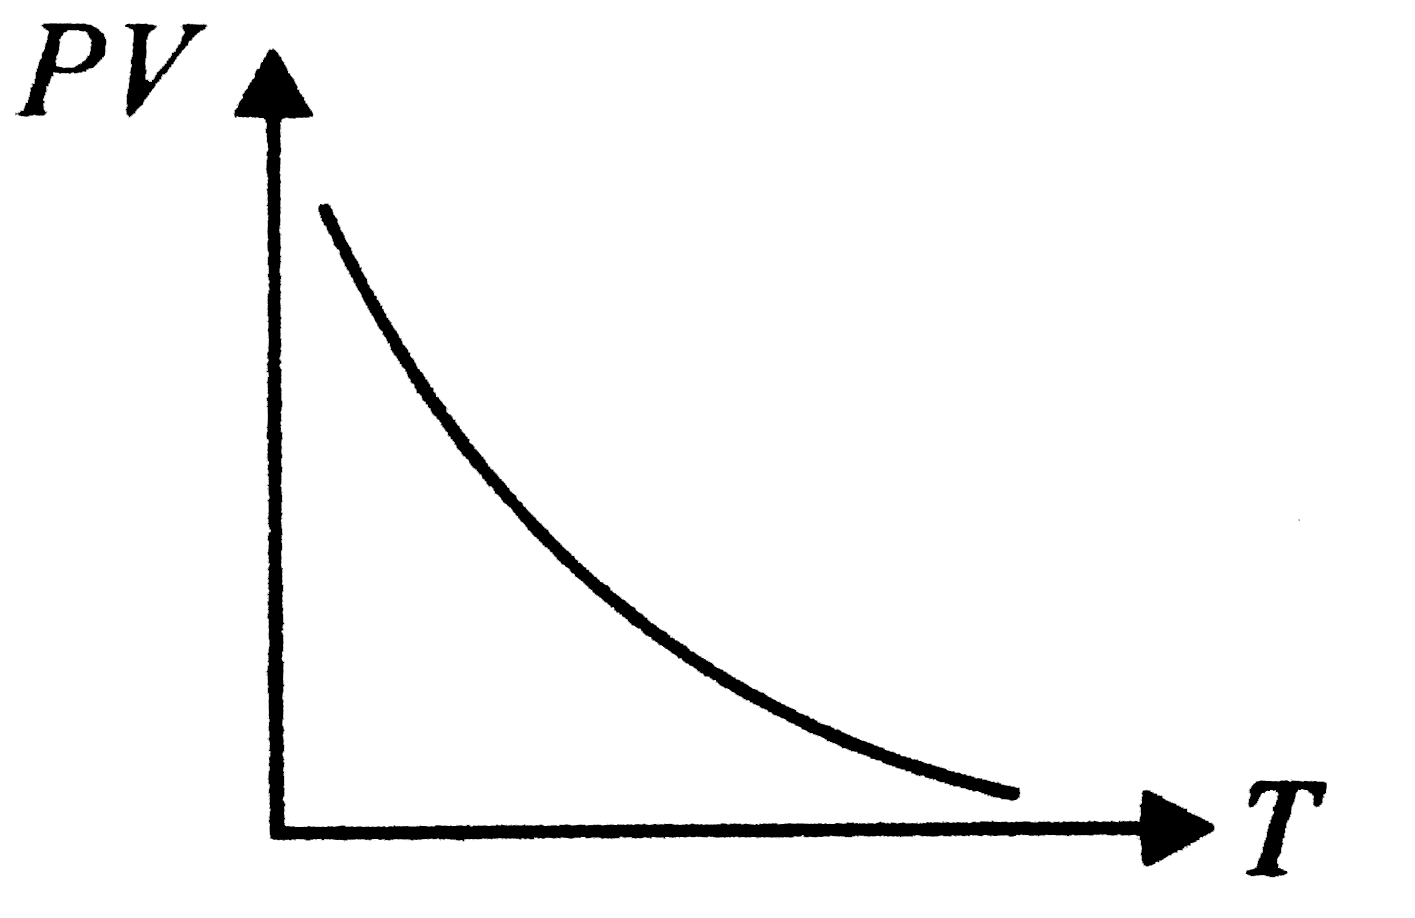
Which of the following curve is correct for a given amount of an ideal gas at constant pressure?
View SolutionTen moles of an ideal gas are filled in a closed vessel. The vessel has cylinder and piston type arrangement and pressure of the gas remains constant at 0.821 atm. Which of the following graph represents correct variation of log V vs log T?
(V = Volume in litre and T = temperature in Kelvin)
View SolutionWhich of the following shown the correct relationship between the pressure 'P' and density ρ of an ideal gas at constant temperature?
View SolutionWhich of the following is a correct plot of the volume of fixed amount of ideal gas as a function of temperature (at constant pressure)
View SolutionAn inflated rubber ballon contains one mole of an ideal gas , has a pressure P, volume V and temperature T. If the temperature rises to 1.1 T, and the volume isincreased to 1.05 V, the final pressure will be
View SolutionChoose the correct graph between pressure and volume of ideal gas.
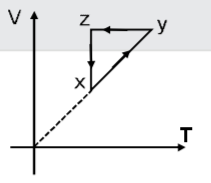
View SolutionAt which one of the following temperature pressure conditions, the deviation of a gas from ideal behavior is expected to be minimum?
View Solution

