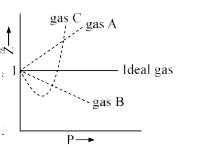
The given graph represents the variations of compressibility factor Z=pv/nRT vs P for three real gases Which of the following statements is wrong?

For gas A, a=0 and Z will linearly depend on pressure
For gas B, b=0 and Z will linearly depend on pressure
Gas C is a real gas and we can find ‘a’ and ‘b’ if intersection data is given
At high pressure, the slope is positive for all real
The correct Answer is:B
Option (B) is incorrect statement because at high pressure slope of the line will change from negative to positive.
Topper's Solved these Questions
- STATES OF MATTERBook:VMC MODULES ENGLISHChapter:STATES OF MATTERExercise:ILLUSTRATION
Explore 30 Videos
- STATES OF MATTERBook:VMC MODULES ENGLISHChapter:STATES OF MATTERExercise:SOLVED EXAMPLES
Explore 20 Videos
- STATES OF MATTERBook:VMC MODULES ENGLISHChapter:STATES OF MATTERExercise:JEE-Main ( ARCHIVE )
Explore 17 Videos
- STATES OF MATTERBook:VMC MODULES ENGLISHChapter:STATES OF MATTERExercise:IMPECCABLE
Explore 50 Videos
- STOICHIOMETRY - IBook:VMC MODULES ENGLISHChapter:STOICHIOMETRY - IExercise:JEE Advanced (Archive)
Explore 31 Videos
Similar Questions
Which of the following statements is wrong for gases?
View SolutionWhich one of the following statement is wrong for gases ?
View SolutionThe given graph represents the variations of compressibility factor Z=PV/nRT vs P for three real gases A, B, and C.

Identify the incorrect statements.
View SolutionFrom the given graph

Which of the following statement is correct ?
View SolutionConsider the equation Z=PVRT. Which of the following statements is correct?
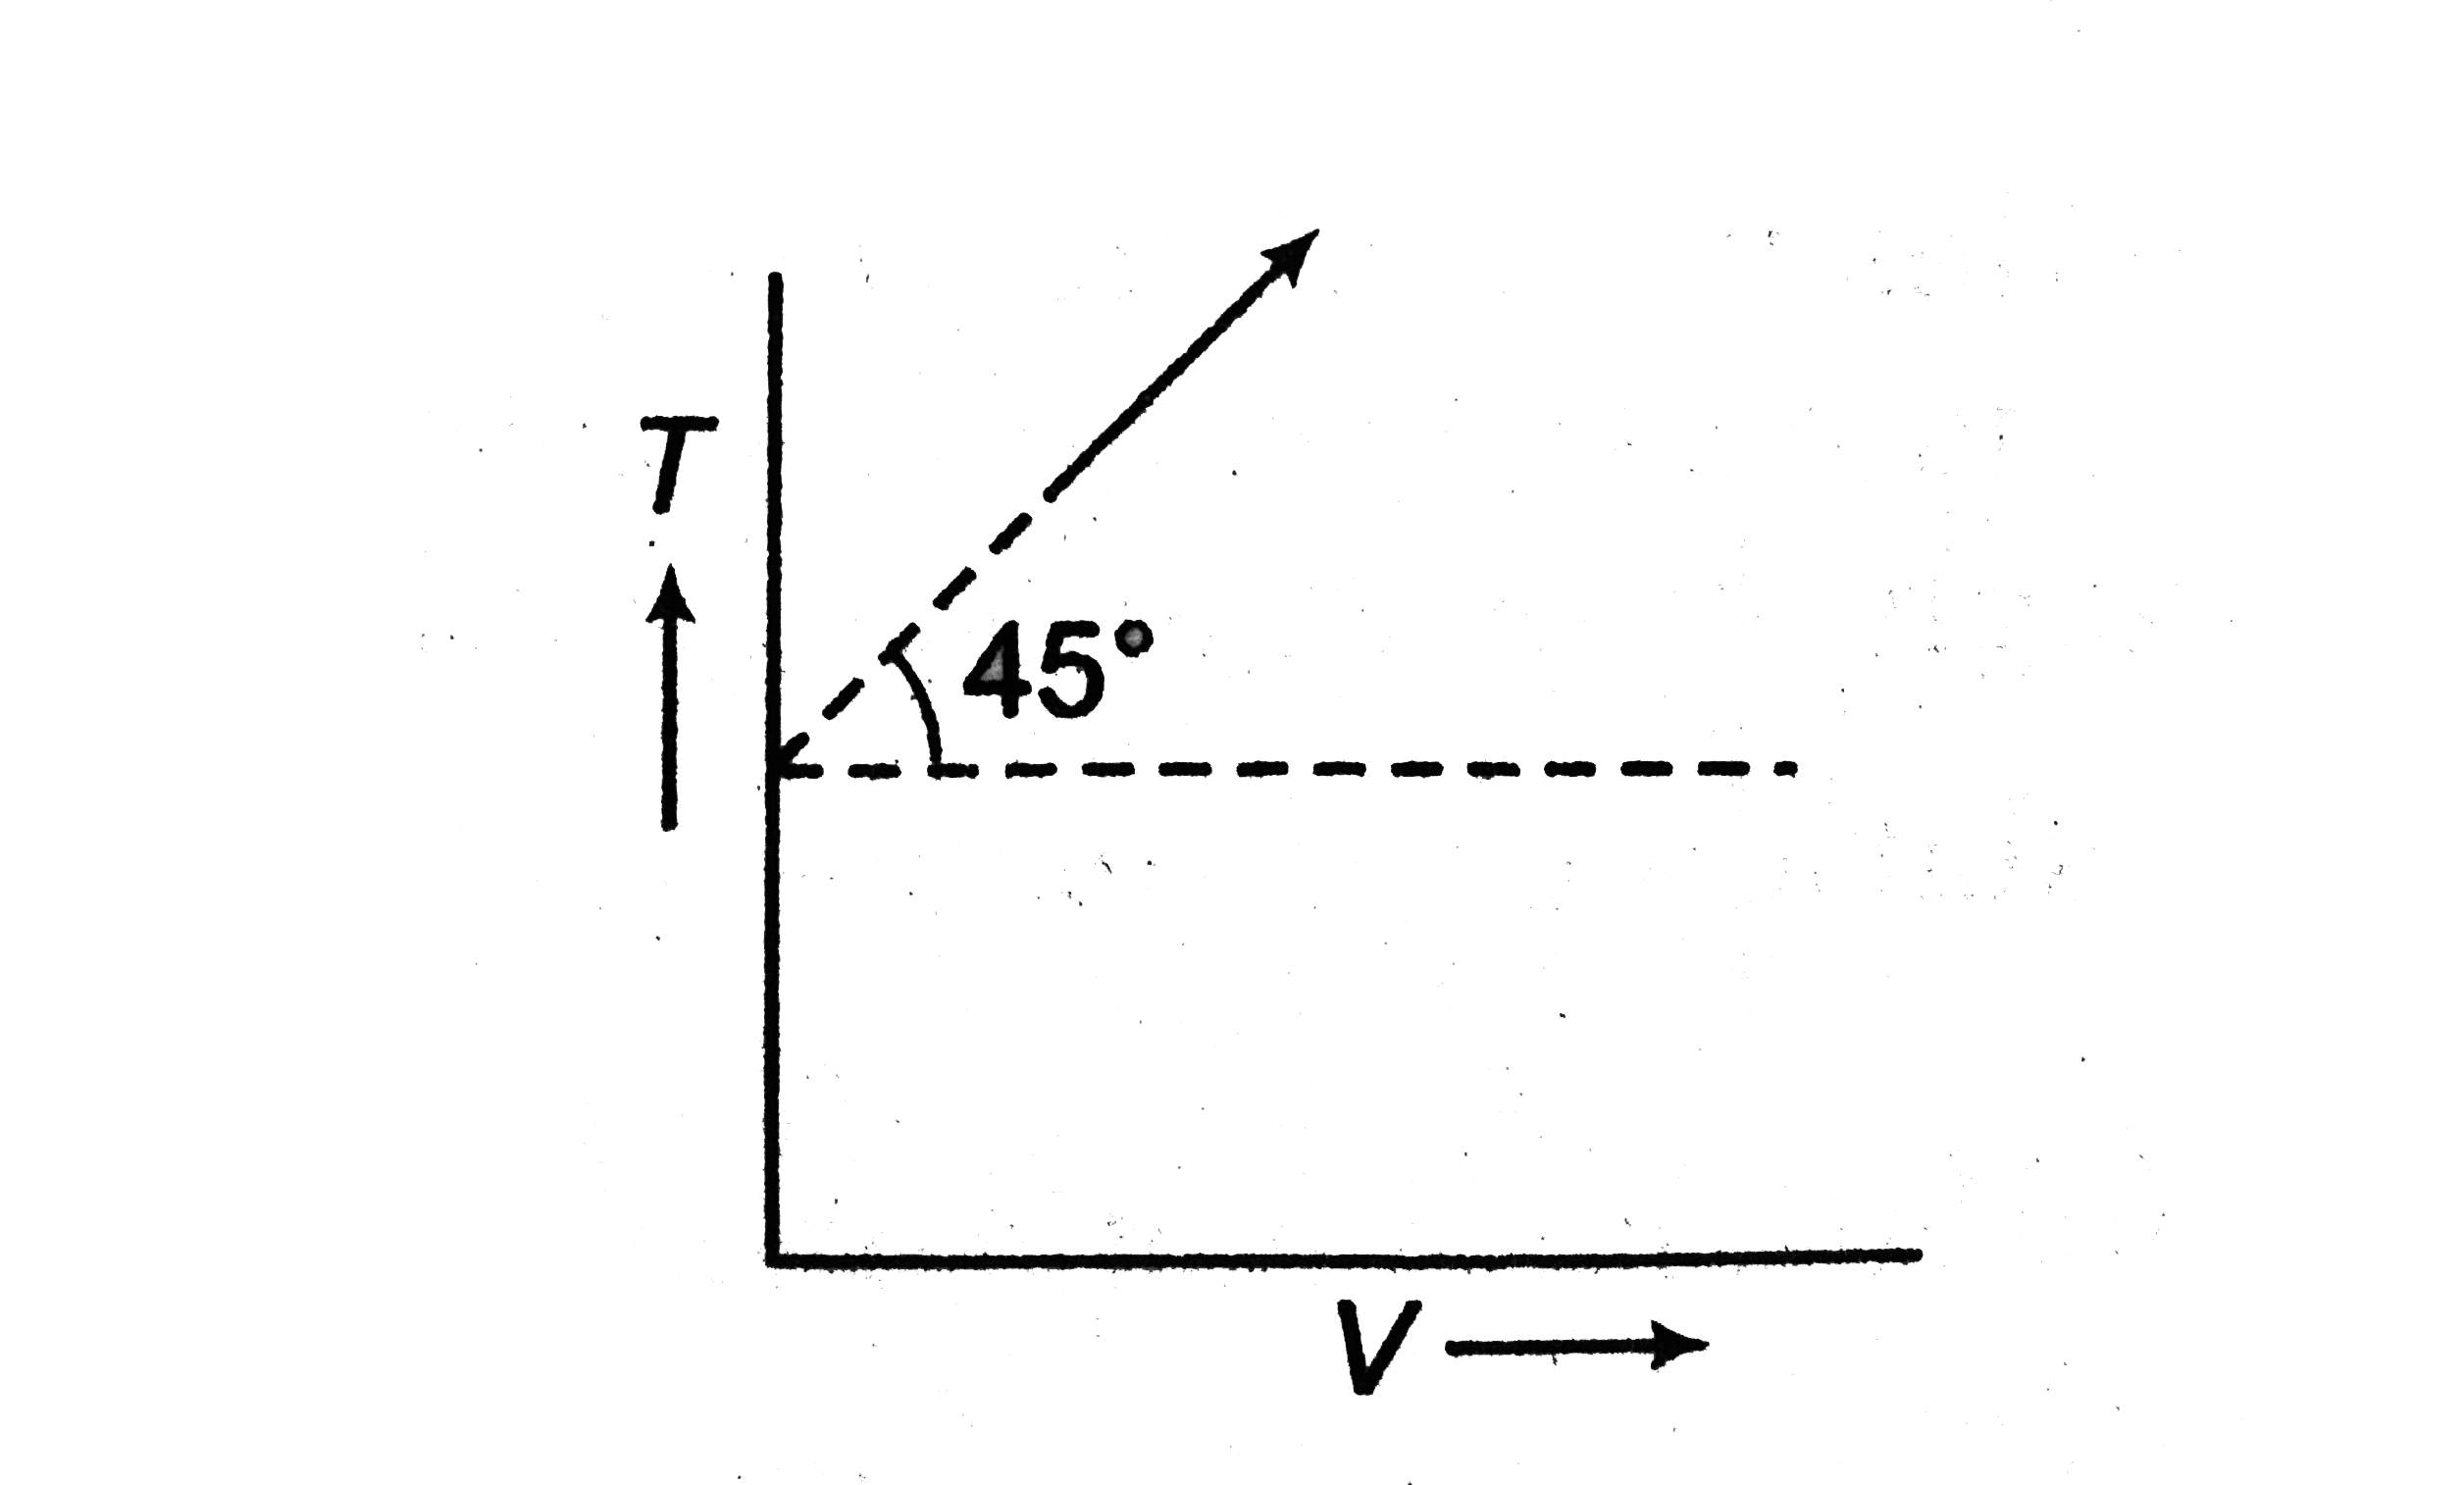
View SolutionThe given curve represents the variation of temperatue as a function of volume for one mole of an ideal gas. Which of the following curves best represents the variation of pressure as a function of volume ?
 .
.
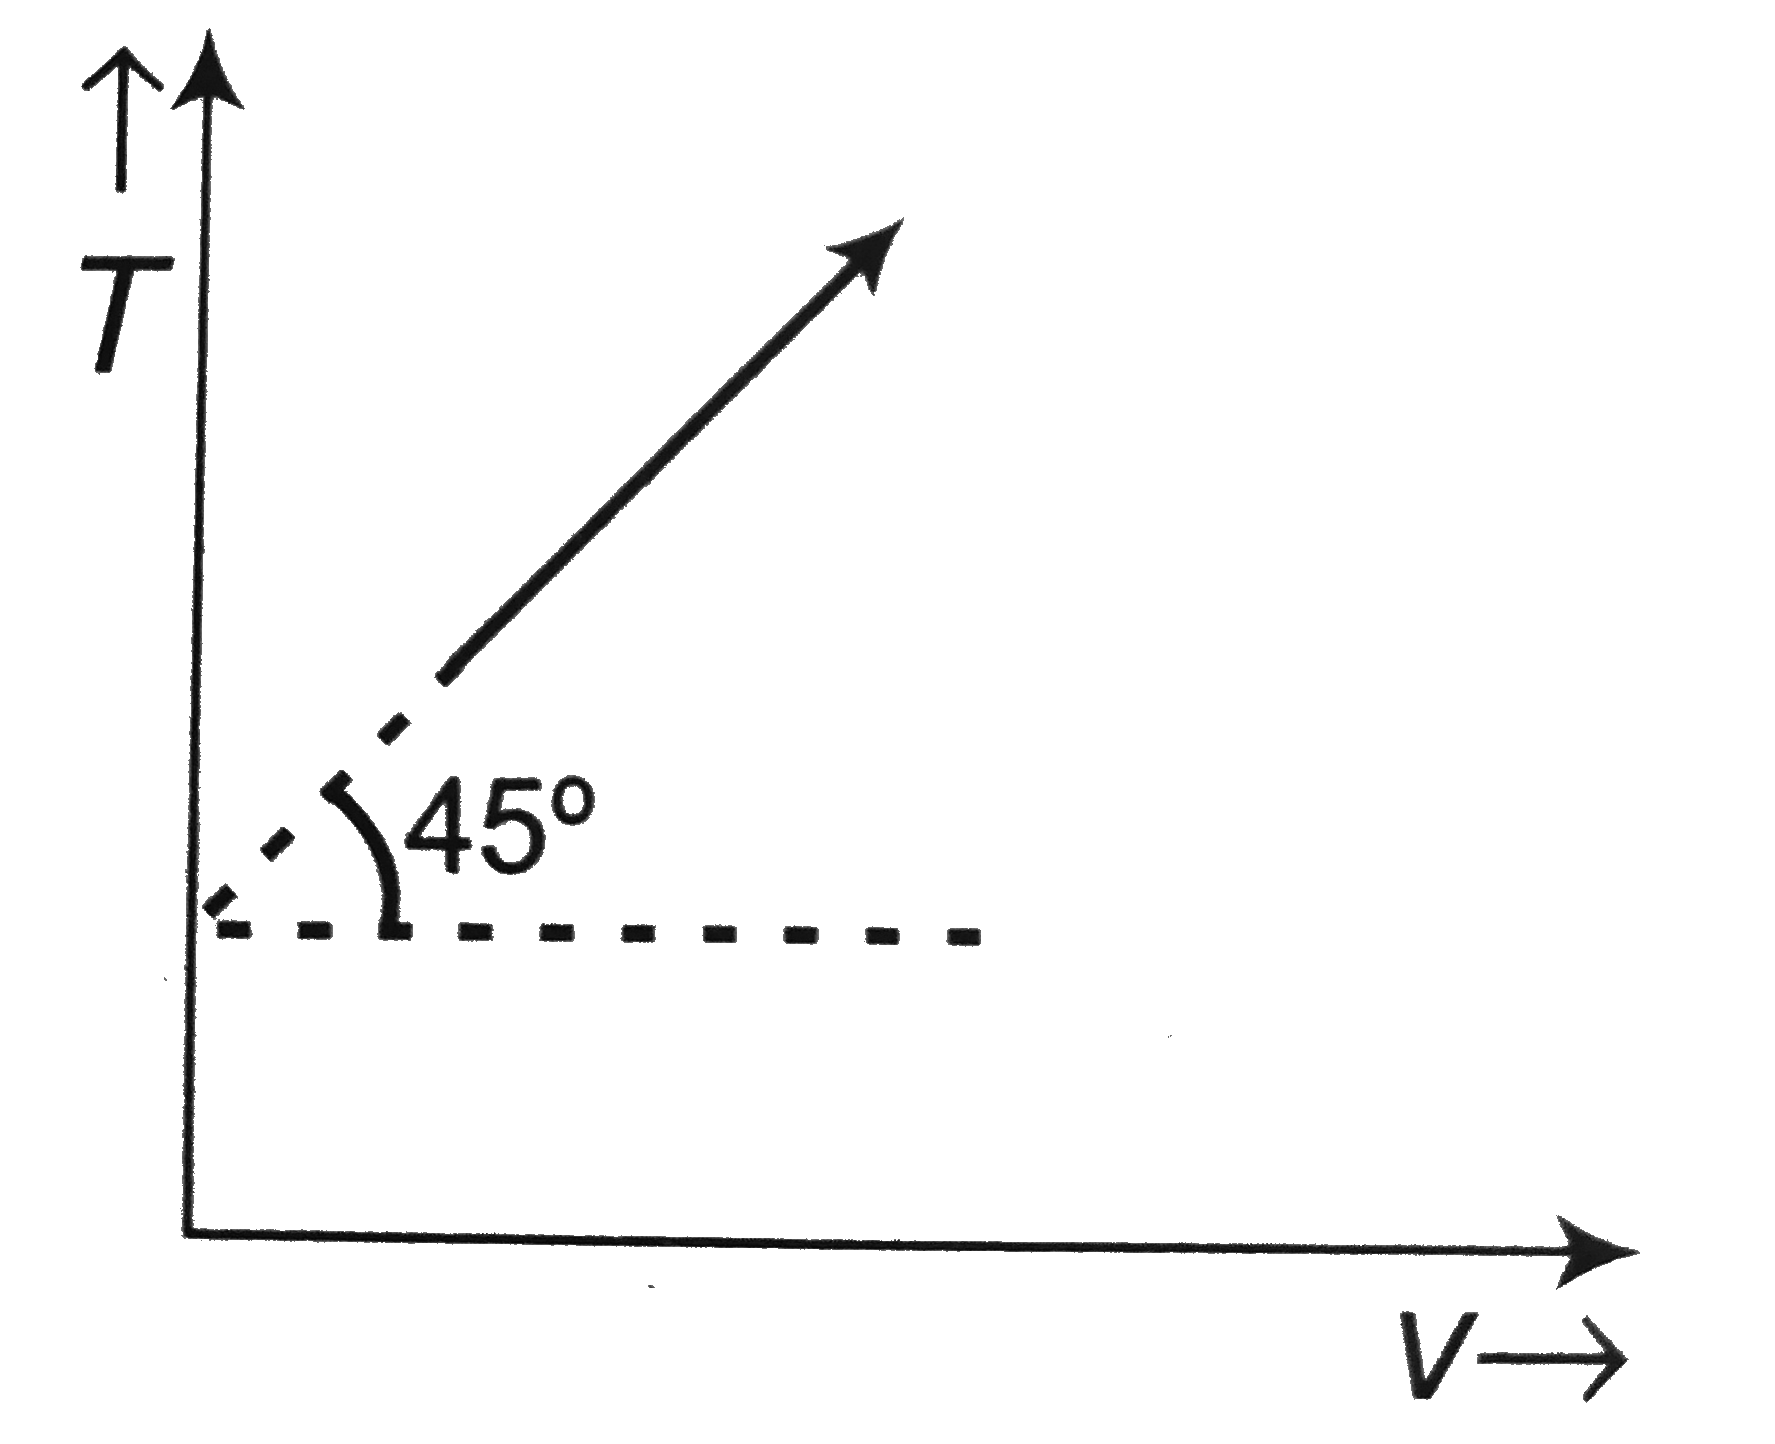
View SolutionThe given curve represents the variation of temperatue as a function of volume for one mole of an ideal gas. Which of the following curves best represents the variation of pressure as a function of volume ?
 .
.
View SolutionFigure displays the plot of the compression factor Z verses p for a few gases
Which of the following statements is//are correct for a van-der waals gas:
View SolutionThe given curve represents the variation of temperature as a function of volume for one mole of an ideal gas. Which of the following curves best represents the variation of pressure as a function of volume?

View SolutionThe given curve represents the variation of temperature as a function of volume for one mole of an ideal gas. Which of the following curves best represents the variation of pressure as a function of volume?

View Solution