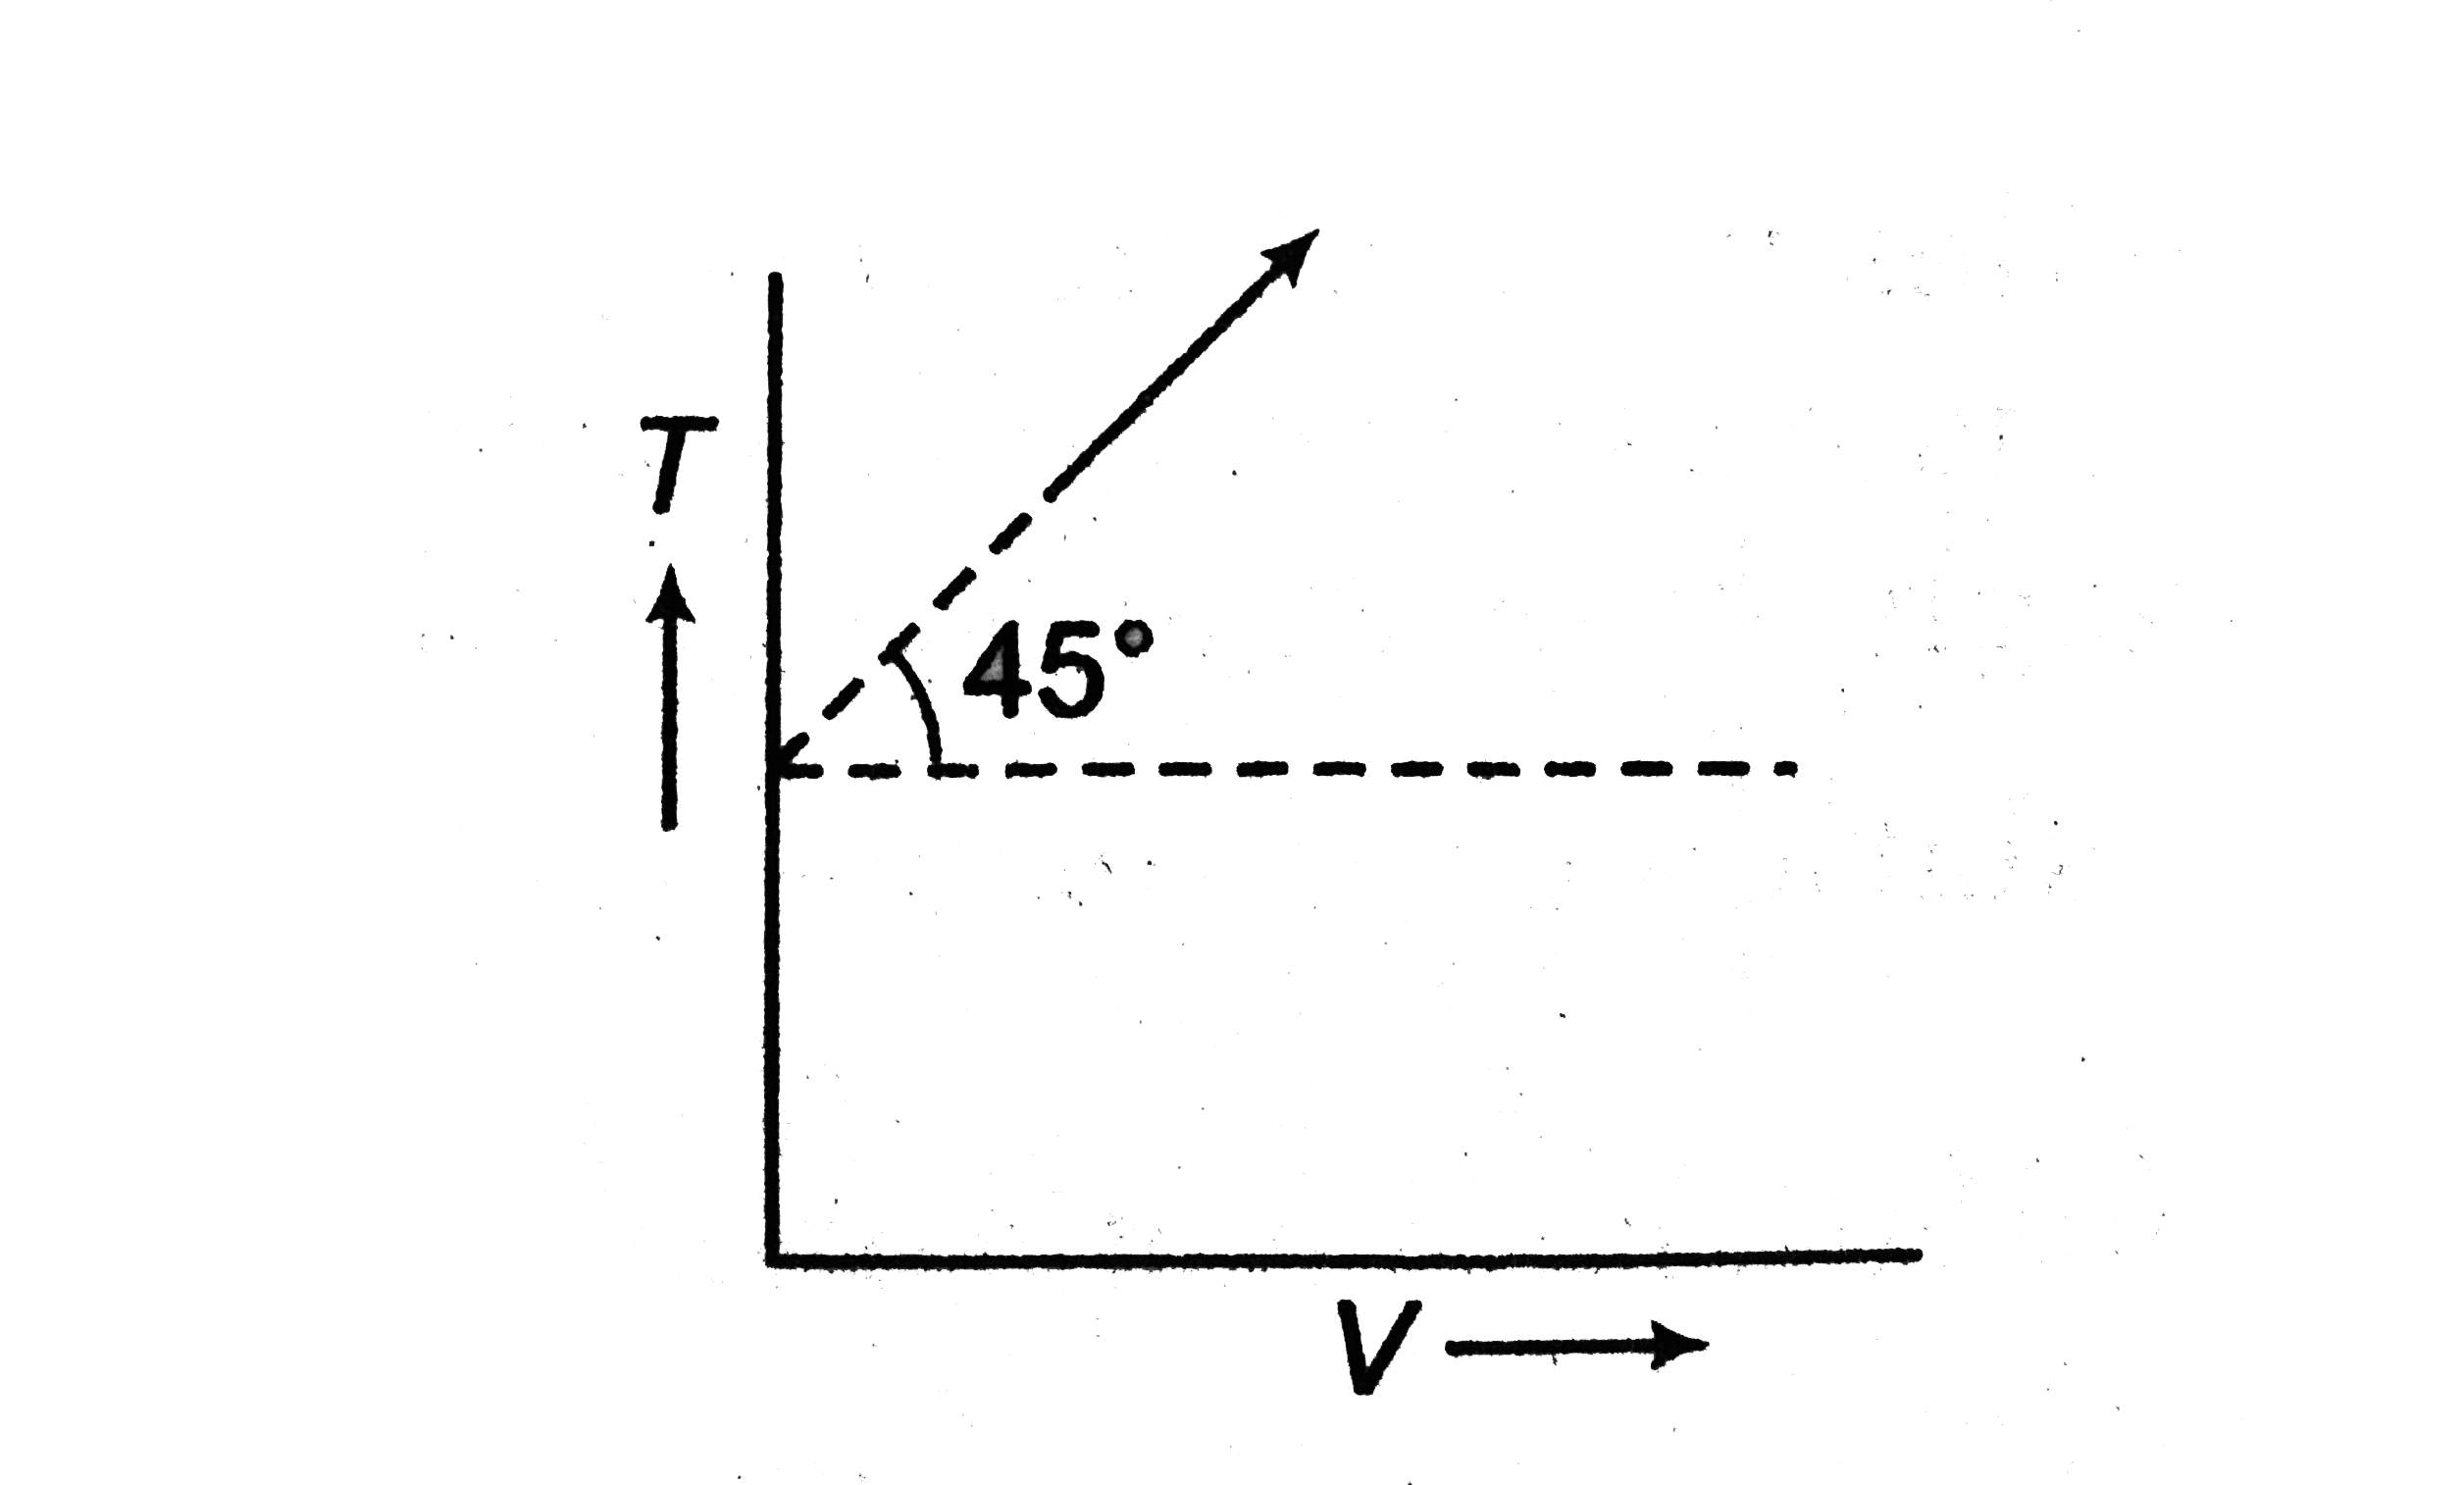
The given curve represents the variation of temperatue as a function of volume for one mole of an ideal gas. Which of the following curves best represents the variation of pressure as a function of volume ?
 .
.
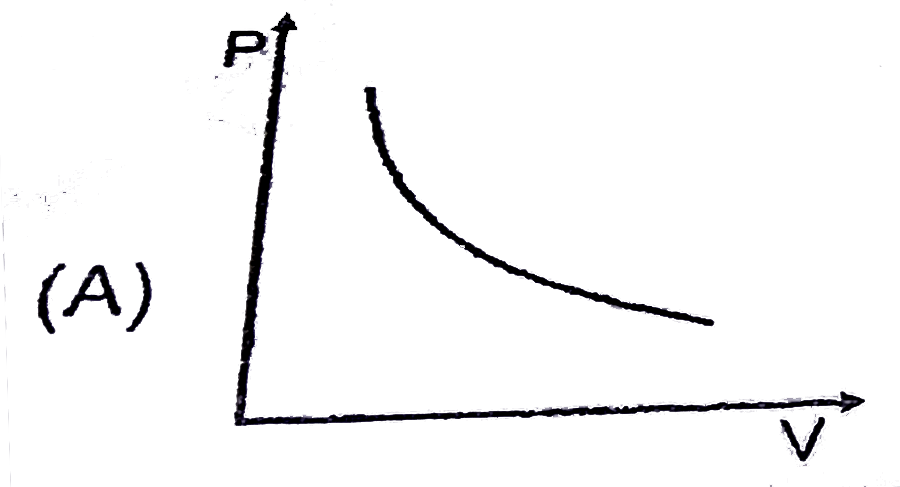
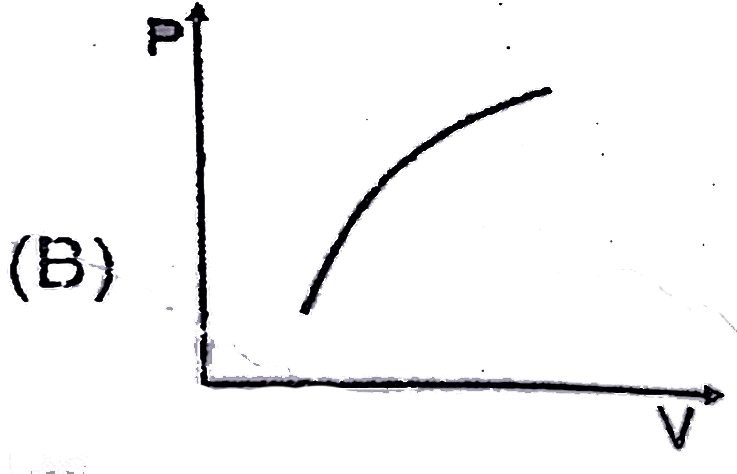
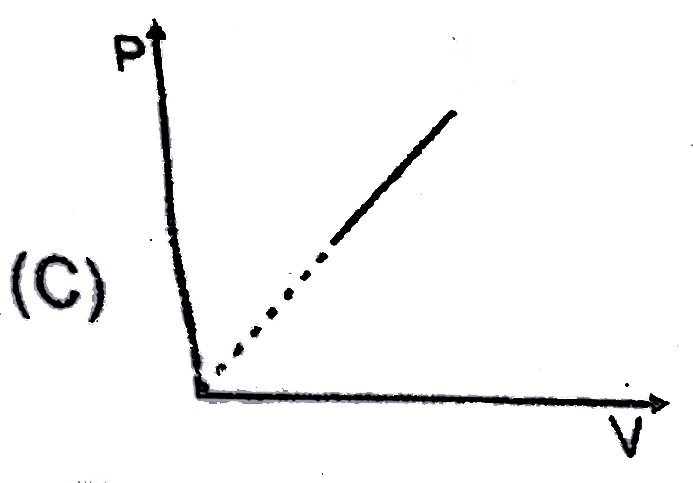
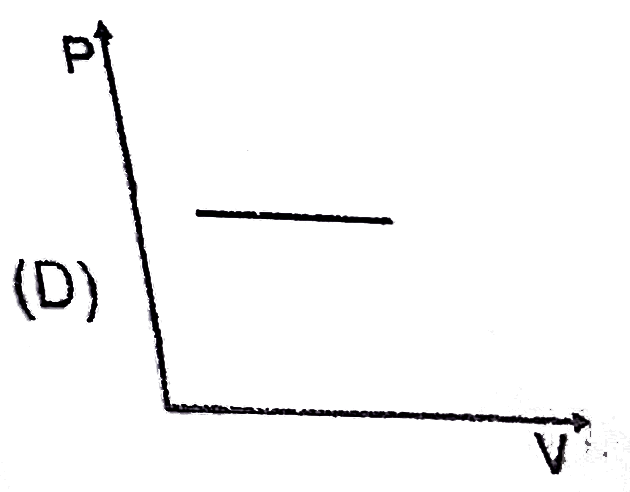
The correct Answer is:A
Here, T=Vtan45∘+T0⇒T=V+T0
And, P=nRTV,
∴PVR=V+T0 (Since, n=1)
∴(P−R)V=RT0
Therefore, Graph will be rectangular hyperbola.
Topper's Solved these Questions
- BOOK - RESONANCE ENGLISHCHAPTER - KTG & THERMODYNAMICSEXERCISE - PART -III25videos
KTG & THERMODYNAMICS
- BOOK - RESONANCE ENGLISHCHAPTER - KTG & THERMODYNAMICSEXERCISE - PART -IV9videos
KTG & THERMODYNAMICS
- BOOK - RESONANCE ENGLISHCHAPTER - KTG & THERMODYNAMICSEXERCISE - Exercise-21videos
KTG & THERMODYNAMICS
- BOOK - RESONANCE ENGLISHCHAPTER - KINETIC THEORY OF GASES AND THERMODYNAMICSEXERCISE - Exercise64videos
KINETIC THEORY OF GASES AND THERMODYNAMICS
- BOOK - RESONANCE ENGLISHCHAPTER - MAGNETIC FIELD AND FORCESEXERCISE - Exercise64videos
MAGNETIC FIELD AND FORCES
Similar Questions
Which of the following curves represents the Henry's law ?
View SolutionWhich of the following curves represent(s) Boyle's law?
View SolutionWhich of the following P-V curve best represents. As isothermal process?
View SolutionWhich of the following graphs best represents the variation of acceleration 'a' with displacement x?
View SolutionWhich of the following curves does not represent motion in one dimensions?
View SolutionWhich of the following graphs correctly represents the variation of g on the - Earth?
View SolutionWhich of the following curve is correct for an ideal gas ?
View SolutionWhich of the following represents logistic growth curve?
View SolutionWhich of the following curve represent variation of density of water with temperature best-
View SolutionWhich of the following curve represents the variation of λM with √C for AgNO3?
View Solution

