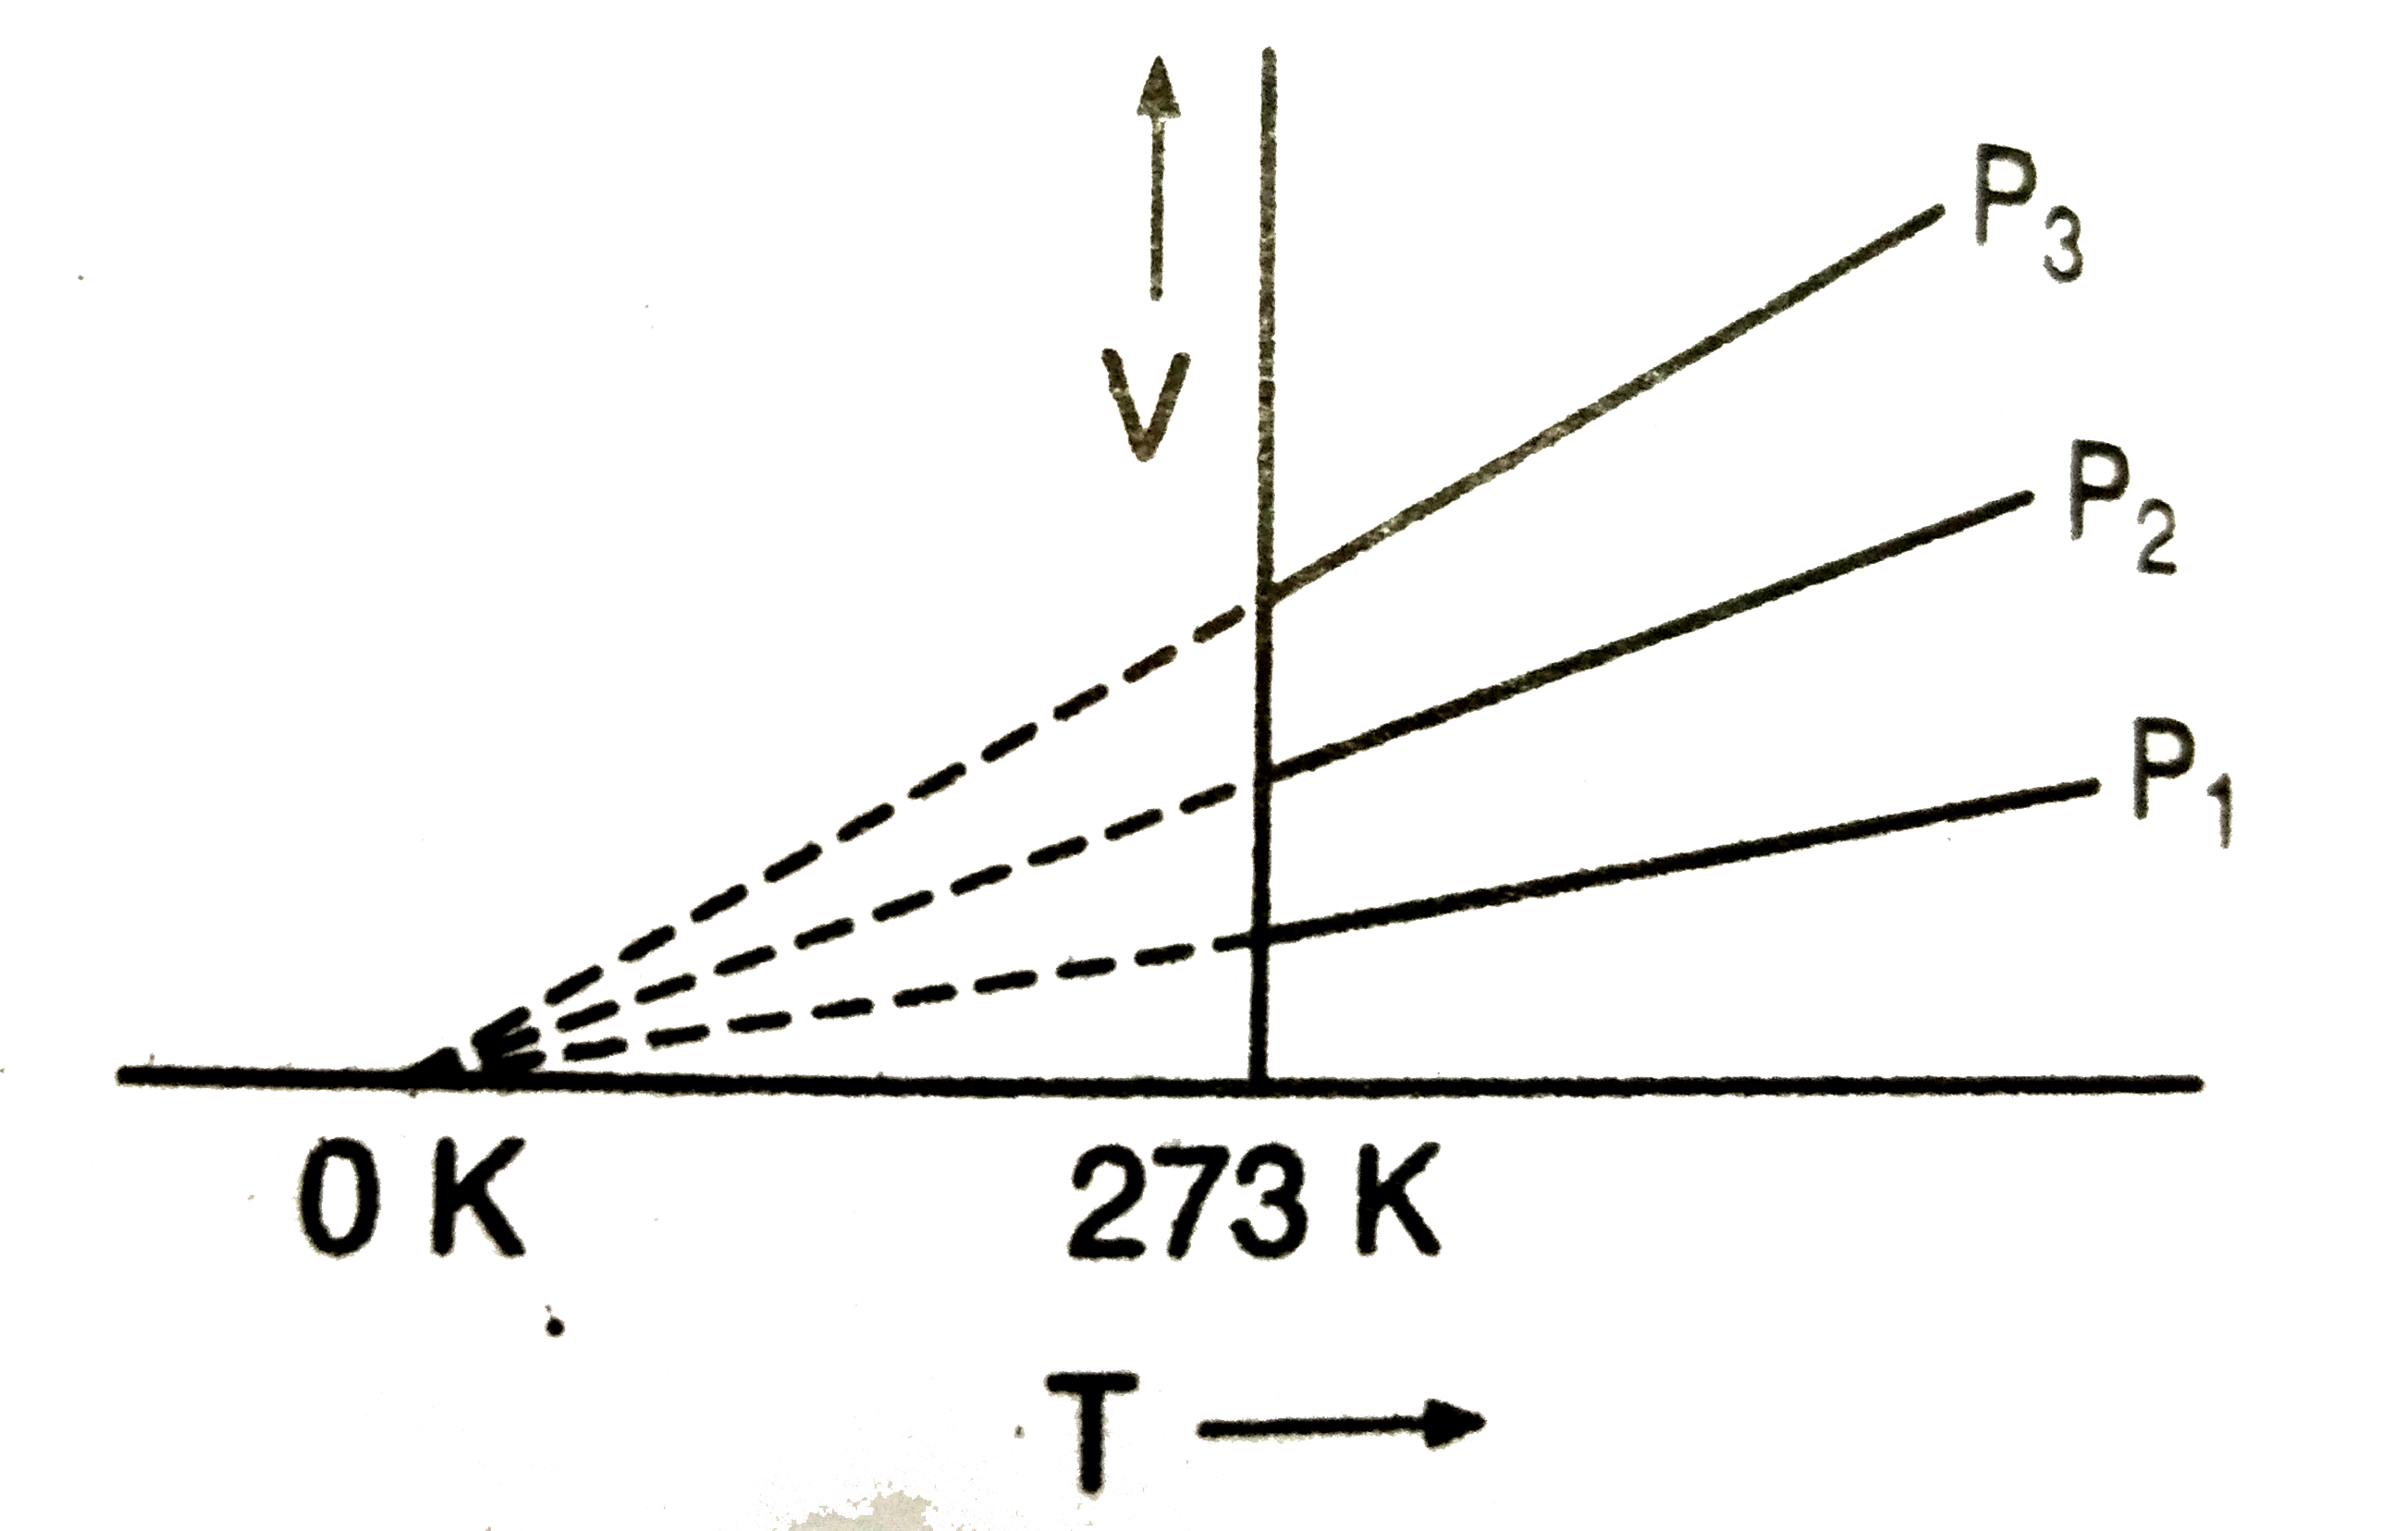
For a fixed mass of gas and constant pressure, which of the following graphs is / are correct?

(1) I
(2) I, II, IV
(3) I, II, III
(4) II, III, IV
Step by step video & image solution for For a fixed mass of gas and constant pressure, which of the following graphs is / are correct? by Chemistry experts to help you in doubts & scoring excellent marks in Class 11 exams.
Updated on:21/07/2023Topper's Solved these Questions
- STATES OF MATTERBOOK - CENGAGE CHEMISTRY ENGLISHCHAPTER - STATES OF MATTEREXERCISE - Exercises
21 Videos
- STATES OF MATTERBOOK - CENGAGE CHEMISTRY ENGLISHCHAPTER - STATES OF MATTEREXERCISE - Linked Comprehensive
2 Videos
- STATES OF MATTERBOOK - CENGAGE CHEMISTRY ENGLISHCHAPTER - STATES OF MATTEREXERCISE - Exercises (Ture False)
25 Videos
- SOME BASIC CONCEPTS AND MOLE CONCEPTBOOK - CENGAGE CHEMISTRY ENGLISHCHAPTER - SOME BASIC CONCEPTS AND MOLE CONCEPTEXERCISE - Archives Subjective
11 Videos
- STOICHIOMETRYBOOK - CENGAGE CHEMISTRY ENGLISHCHAPTER - STOICHIOMETRYEXERCISE - Archives Subjective
33 Videos
Similar Questions
Which of the following graph is incorrect for an ideal gas?

View SolutionIf an ideal gas is heated at constant pressure :
View SolutionAn ideal gas undergoes adiabatic expansion against constant external pressure. Which of the following is incorrect.
View SolutionThe volume-temperature graphs of a given mass of an ideal gas at constant pressure are shown below. What is the correct order of pressure ?

View SolutionV vs T curves at constant pressure P1 and P2 for an ideal gas are shown in the figure. Which of the following is correct?

View SolutionTen moles of an ideal gas are filled in a closed vessel. The vessel has cylinder and piston type arrangement and pressure of the gas remains constant at 0.821 atm. Which of the following graph represents correct variation of log V vs log T?
(V = Volume in litre and T = temperature in Kelvin)
View SolutionA sample of gas follow process represented by PV2 = constant . Bulk modulus for this process is B, then which of the following graph is correct ?
View SolutionIf x/m is the mass of adsorbate adsorbed per unit mass of adsorbent, P is the pressure of the adsorbate gas ,a and b are constant ,which of the following represent "Langmuir adsorption isotherm"?
View SolutionThe given (p - U) graph shows the variation of internal energy of an ideal gas with increase in pressure. Which of the following pressure - volume graph is equivalent to this graph ?
 .
.
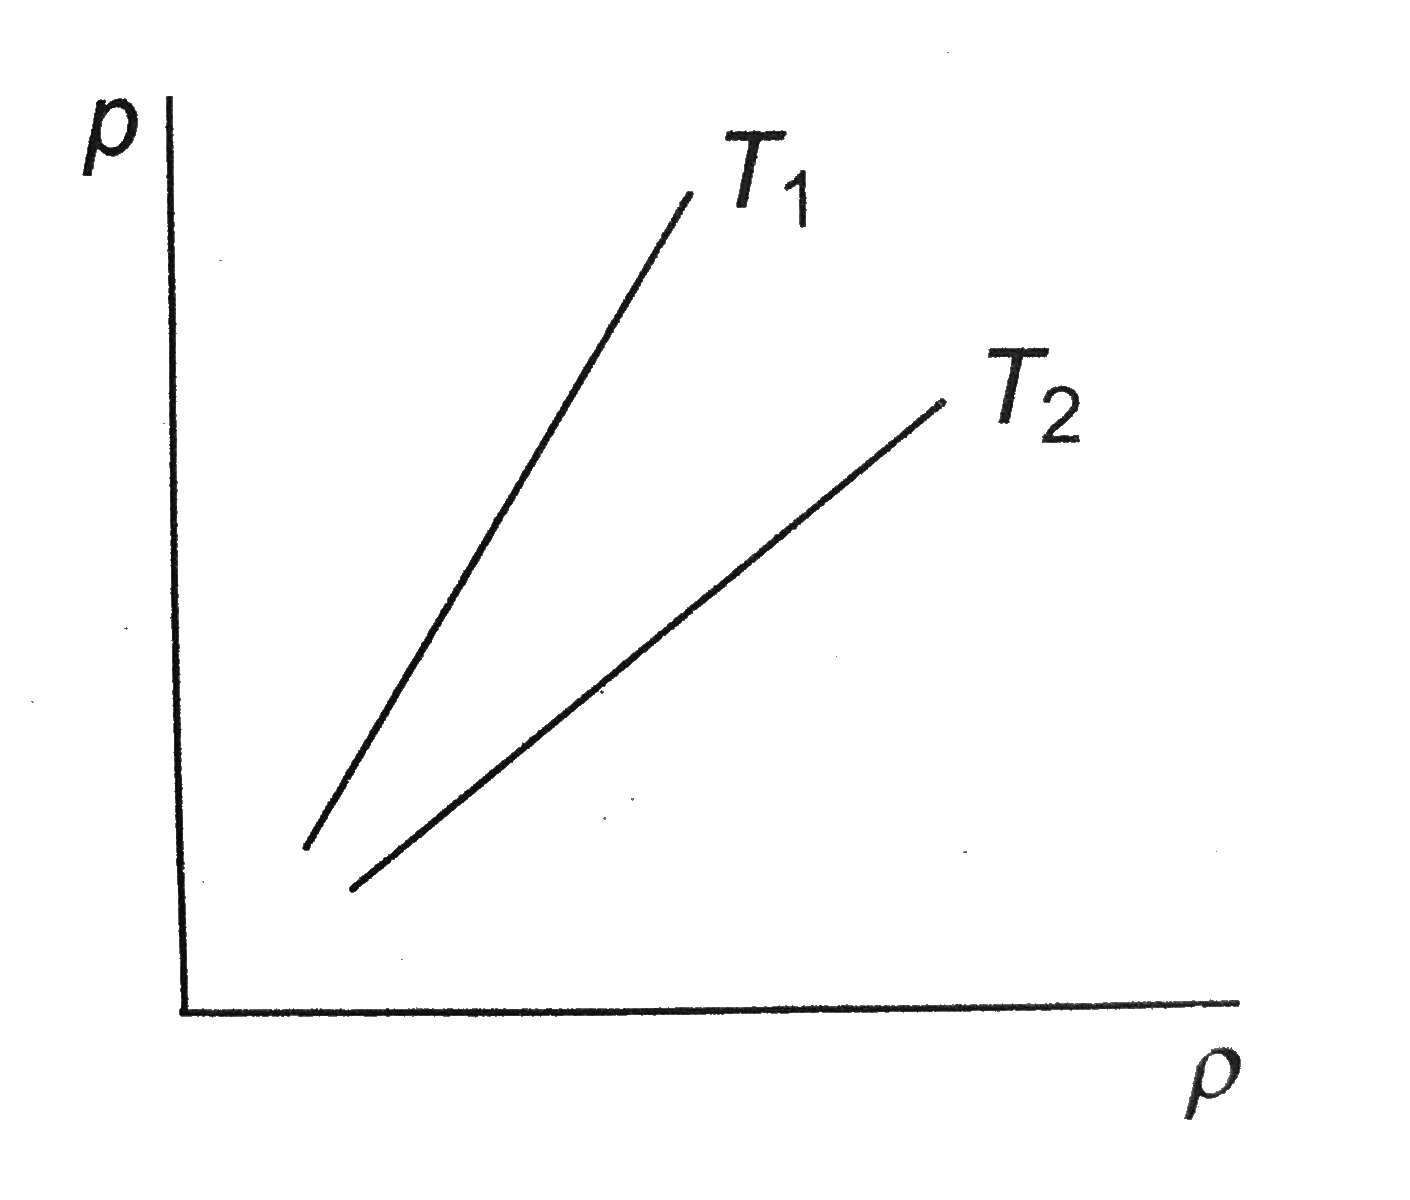
View SolutionFigure shows graphs of pressure vs density for an ideal gas at two temperature T1andT2. Which of the following is correct?

View Solution
