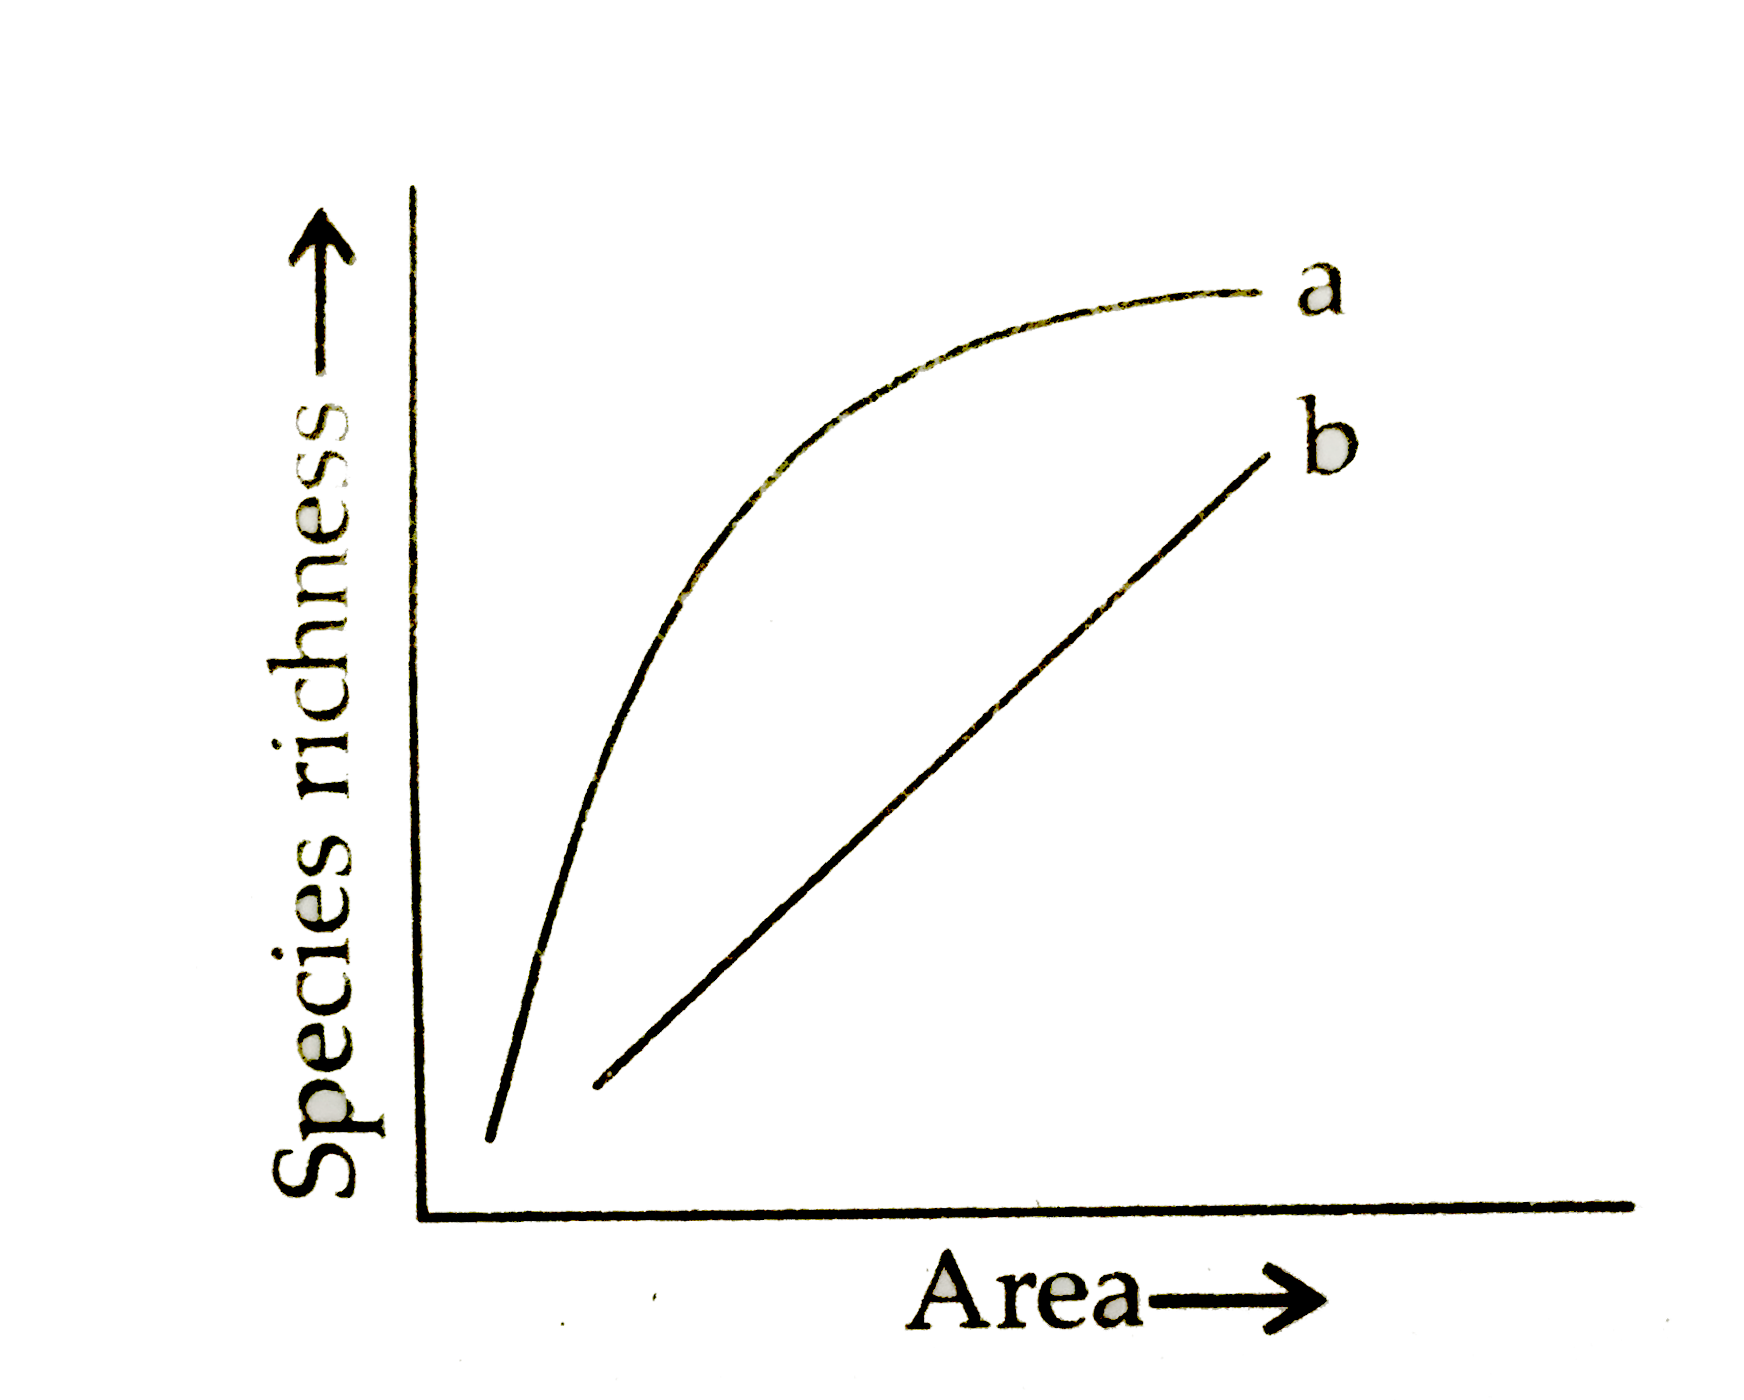
In the equation of species-area relationship, the letter 'C' and 'Z' represent
Option1 C = Regression coefficient,Z = y - intercept
Option2 C= slope of the line,Z = regression coefficient
Option3 C = y - intercept,Z = slope of the line (regression coefficient)
Option4 Both 2 and 3
The correct Answer is:C
Step-by-Step Solution:
1. Understanding the Species-Area Relationship: The species-area relationship describes how the number of species (species richness) increases with the area being studied. This concept was developed by Alexander von Humboldt.
2. Identifying the Equation: The relationship can be expressed mathematically. The equation for the species-area relationship is given as:
logS=logC+ZlogA
where:
- S = species richness
- C = y-intercept
- Z = slope of the line (regression coefficient)
- A = area
3. Interpreting the Variables:
- C (y-intercept): In the context of the equation, C represents the value of species richness when the area is 1 (i.e., when A=1). It is a constant that helps to define the starting point of the relationship on the graph.
- Z (slope): The letter Z represents the slope of the line, indicating how much the species richness increases with an increase in area. It is also referred to as the regression coefficient, which quantifies the relationship between area and species richness.
4. Conclusion: Therefore, in the species-area relationship equation, C is the y-intercept, and Z is the slope of the line.
Final Answer: In the equation of species-area relationship, C represents the y-intercept, and Z represents the slope of the line (regression coefficient).
---
logS=logC+ZlogA
where:
- S = species richness
- C = y-intercept
- Z = slope of the line (regression coefficient)
- A = area
- C (y-intercept): In the context of the equation, C represents the value of species richness when the area is 1 (i.e., when A=1). It is a constant that helps to define the starting point of the relationship on the graph.
- Z (slope): The letter Z represents the slope of the line, indicating how much the species richness increases with an increase in area. It is also referred to as the regression coefficient, which quantifies the relationship between area and species richness.
Topper's Solved these Questions
- BIODIVERSITY AND CONSERVATIONBOOK - VMC MODULES ENGLISHCHAPTER - BIODIVERSITY AND CONSERVATIONEXERCISE - IN-CHAPTER EXERCISE-B
10 Videos
- BIODIVERSITY AND CONSERVATIONBOOK - VMC MODULES ENGLISHCHAPTER - BIODIVERSITY AND CONSERVATIONEXERCISE - PRACTICE EXERCISE-2
5 Videos
- ANATOMY OF FLOWERING PLANTS BOOK - VMC MODULES ENGLISHCHAPTER - ANATOMY OF FLOWERING PLANTS EXERCISE - IMPECCABLE
59 Videos
- BIOLOGICAL CLASSIFICATIONBOOK - VMC MODULES ENGLISHCHAPTER - BIOLOGICAL CLASSIFICATIONEXERCISE - All Questions
214 Videos
Similar Questions
Knowledge Check
Assertion : If the species-area relationship are analysed among very large areas like the entire continents, the value of Z, i.e., slope of line in the range of 0.1 to 0.2.
Reason : The value of Z, i.e., slope of line of species area relationship lies in the range of 0.6 to 1.2 when analysis is done among small areas.Aa) If both assertion and reason are true and reason is the correct explanation of assertion.Bb) If both assertion and reason are true but reason is not the correct explanation of assertion.Cc) If assertion is true but reason is false.Dd) If both assertion and reason are false.
Species area relationship was given by :-
View SolutionThe hyperbolic equation for the species area relationship is
View SolutionOn a logarithmic scale the correct representation of species area relationship is represented by the equation
View SolutionIn the polt of the species - area relationship for the co-efficient z, the axis X and Y, represents
View SolutionThe observation of the species-area relationship was given by Humboldt after his pioneering and extensive ex-plorations in the wilderness of
View SolutionThe above graph show Species-Area relationship. Write the equation of the curve a and explain.

View SolutionThe equation 3y+4z=0 represents a
View Solution
