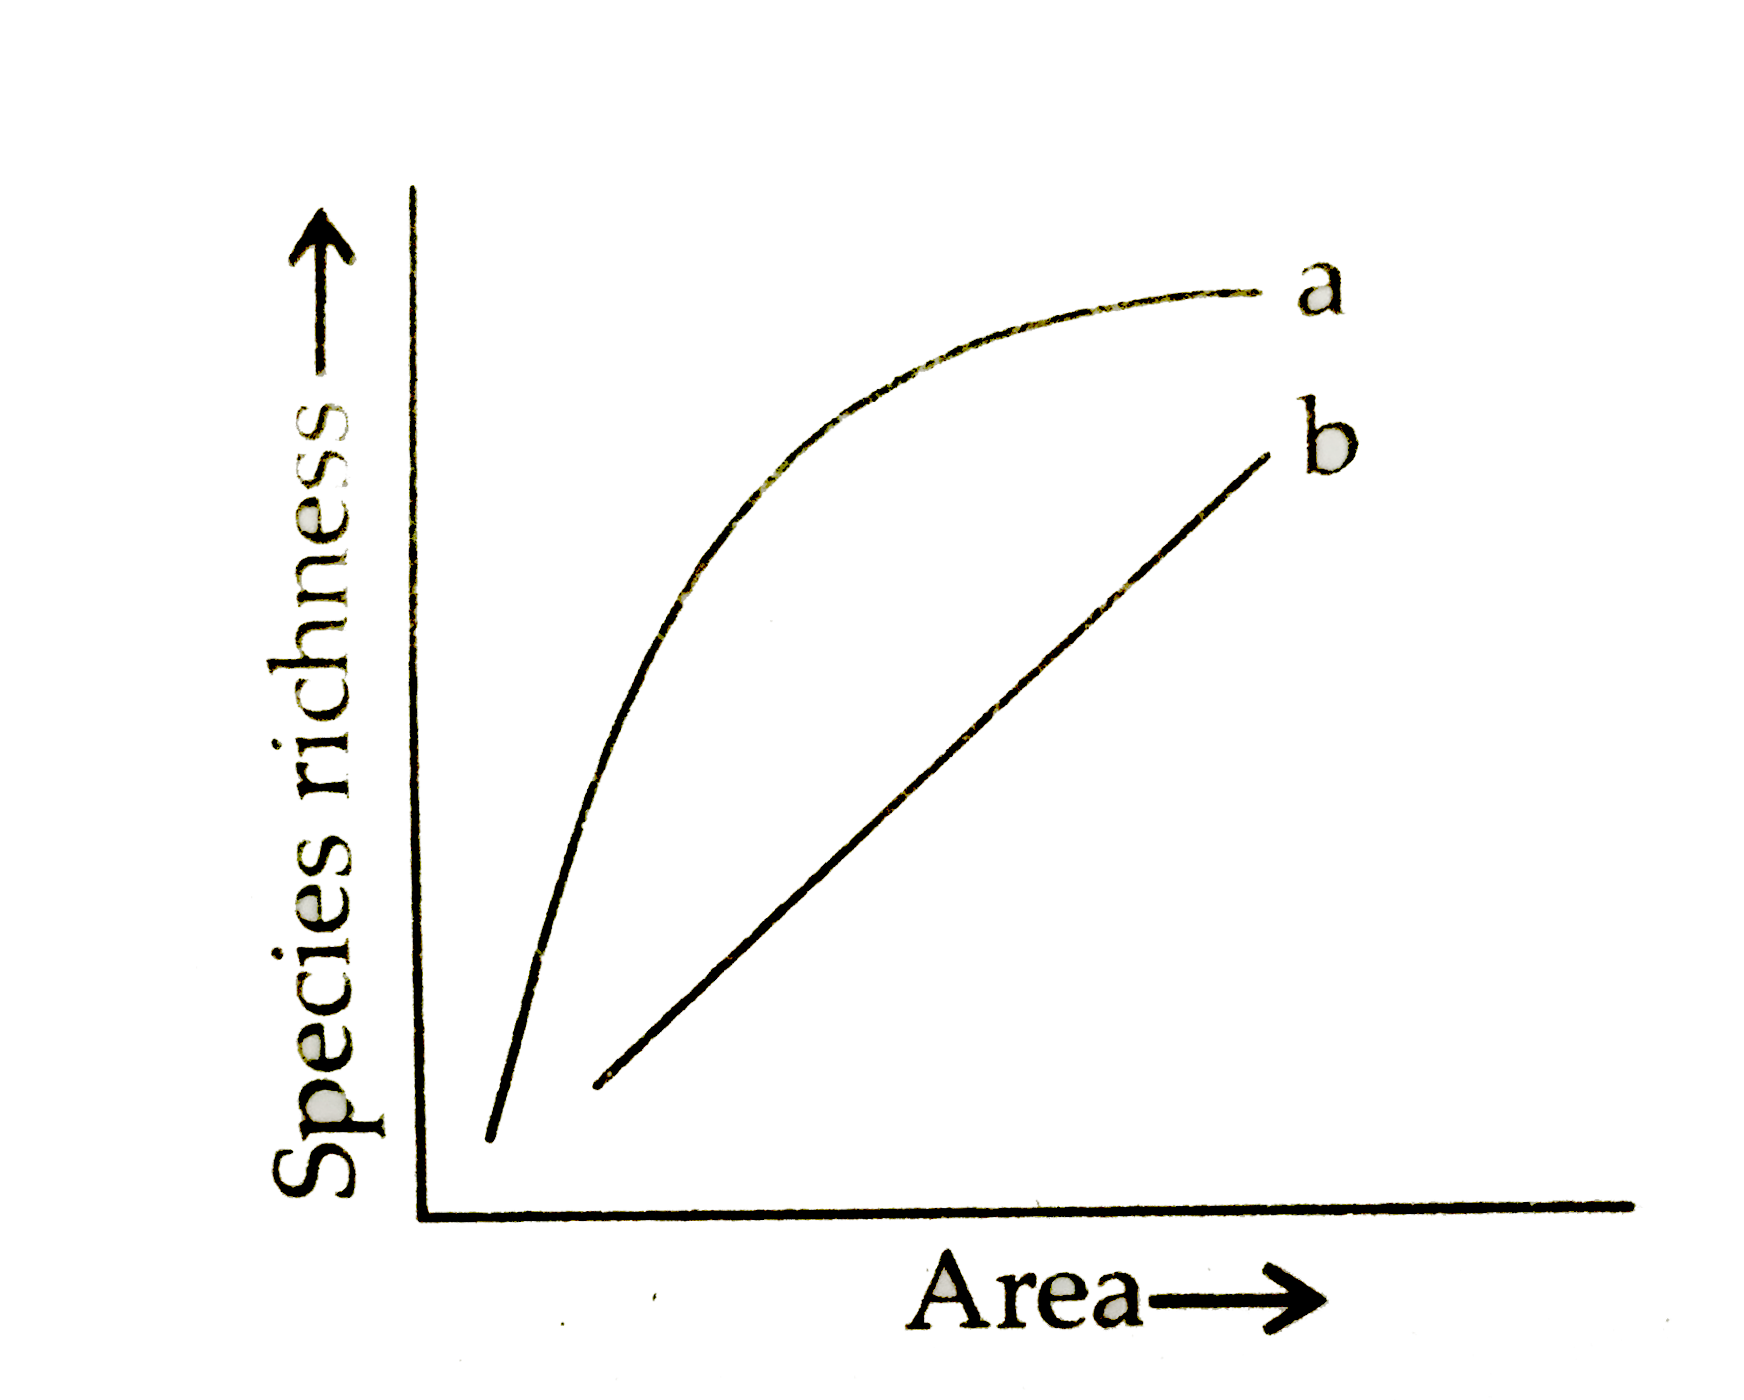
The above graph show Species-Area relationship. Write the equation of the curve a and explain.

On a log scale, the relationship becomes linear (Straight line) and is described equation
log S log C+Z log A
where
S = speices Richness
Z = slope of the line (regression cofficient )
A area
C= y- intercept
Ecologists have found out that the value of Z line ranges between 0.1 and 0.2 irrespective of the taxonomic group or the regio
this analysis in very large area like a continent, the Z value ranges between 0.6 and 1.2. The Z value for frugivorous birds and mammals in the tropical forest is found to be 1.15
Similar Questions
Species area relationship was given by :-
View SolutionWrite the equation to show the process of respiration.
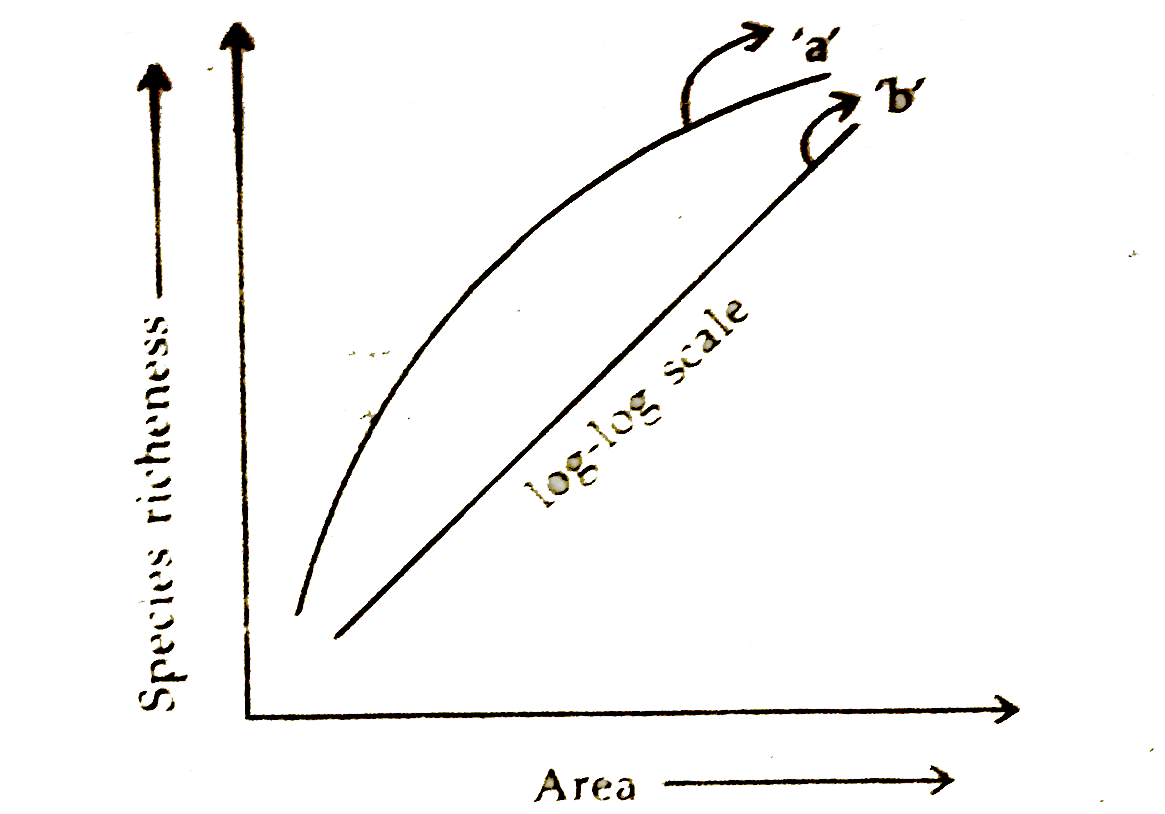
View SolutionThe following graph shows the species area relationship. Answers the Questions as directed.
(a) Name the naturalist who studied the kind of relationship shown in the graph.
Write the observations made by him.
(b) Write the situations as discovered by the ecologists when the value of 'Z' (slope of the line) lies between
(i) 0.1 and 0.2, (ii) 0.6 and 1.2
What does 'Z' stand for ?
(c ) When would the slope of the line 'b' become steeper ?
 View Solution
The following graph shows the species area relationship. Answers the Questions as directed.
(a) Name the naturalist who studied the kind of relationship shown in the graph.
Write the observations made by him.
(b) Write the situations as discovered by the ecologists when the value of 'Z' (slope of the line) lies between
(i) 0.1 and 0.2, (ii) 0.6 and 1.2
What does 'Z' stand for ?
(c ) When would the slope of the line 'b' become steeper ?
 View Solution
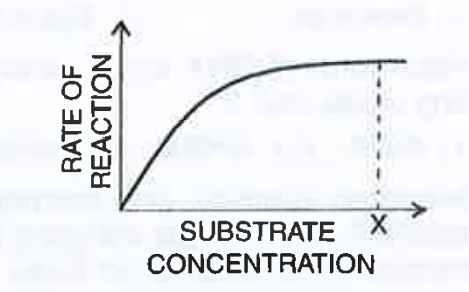
The given graph is showing the relationship between the rate of enzyme reaction and concentration of substrate. At concentration of substrate greater than X, the
 View Solution
According to the concept of species-area relationship.
View Solution
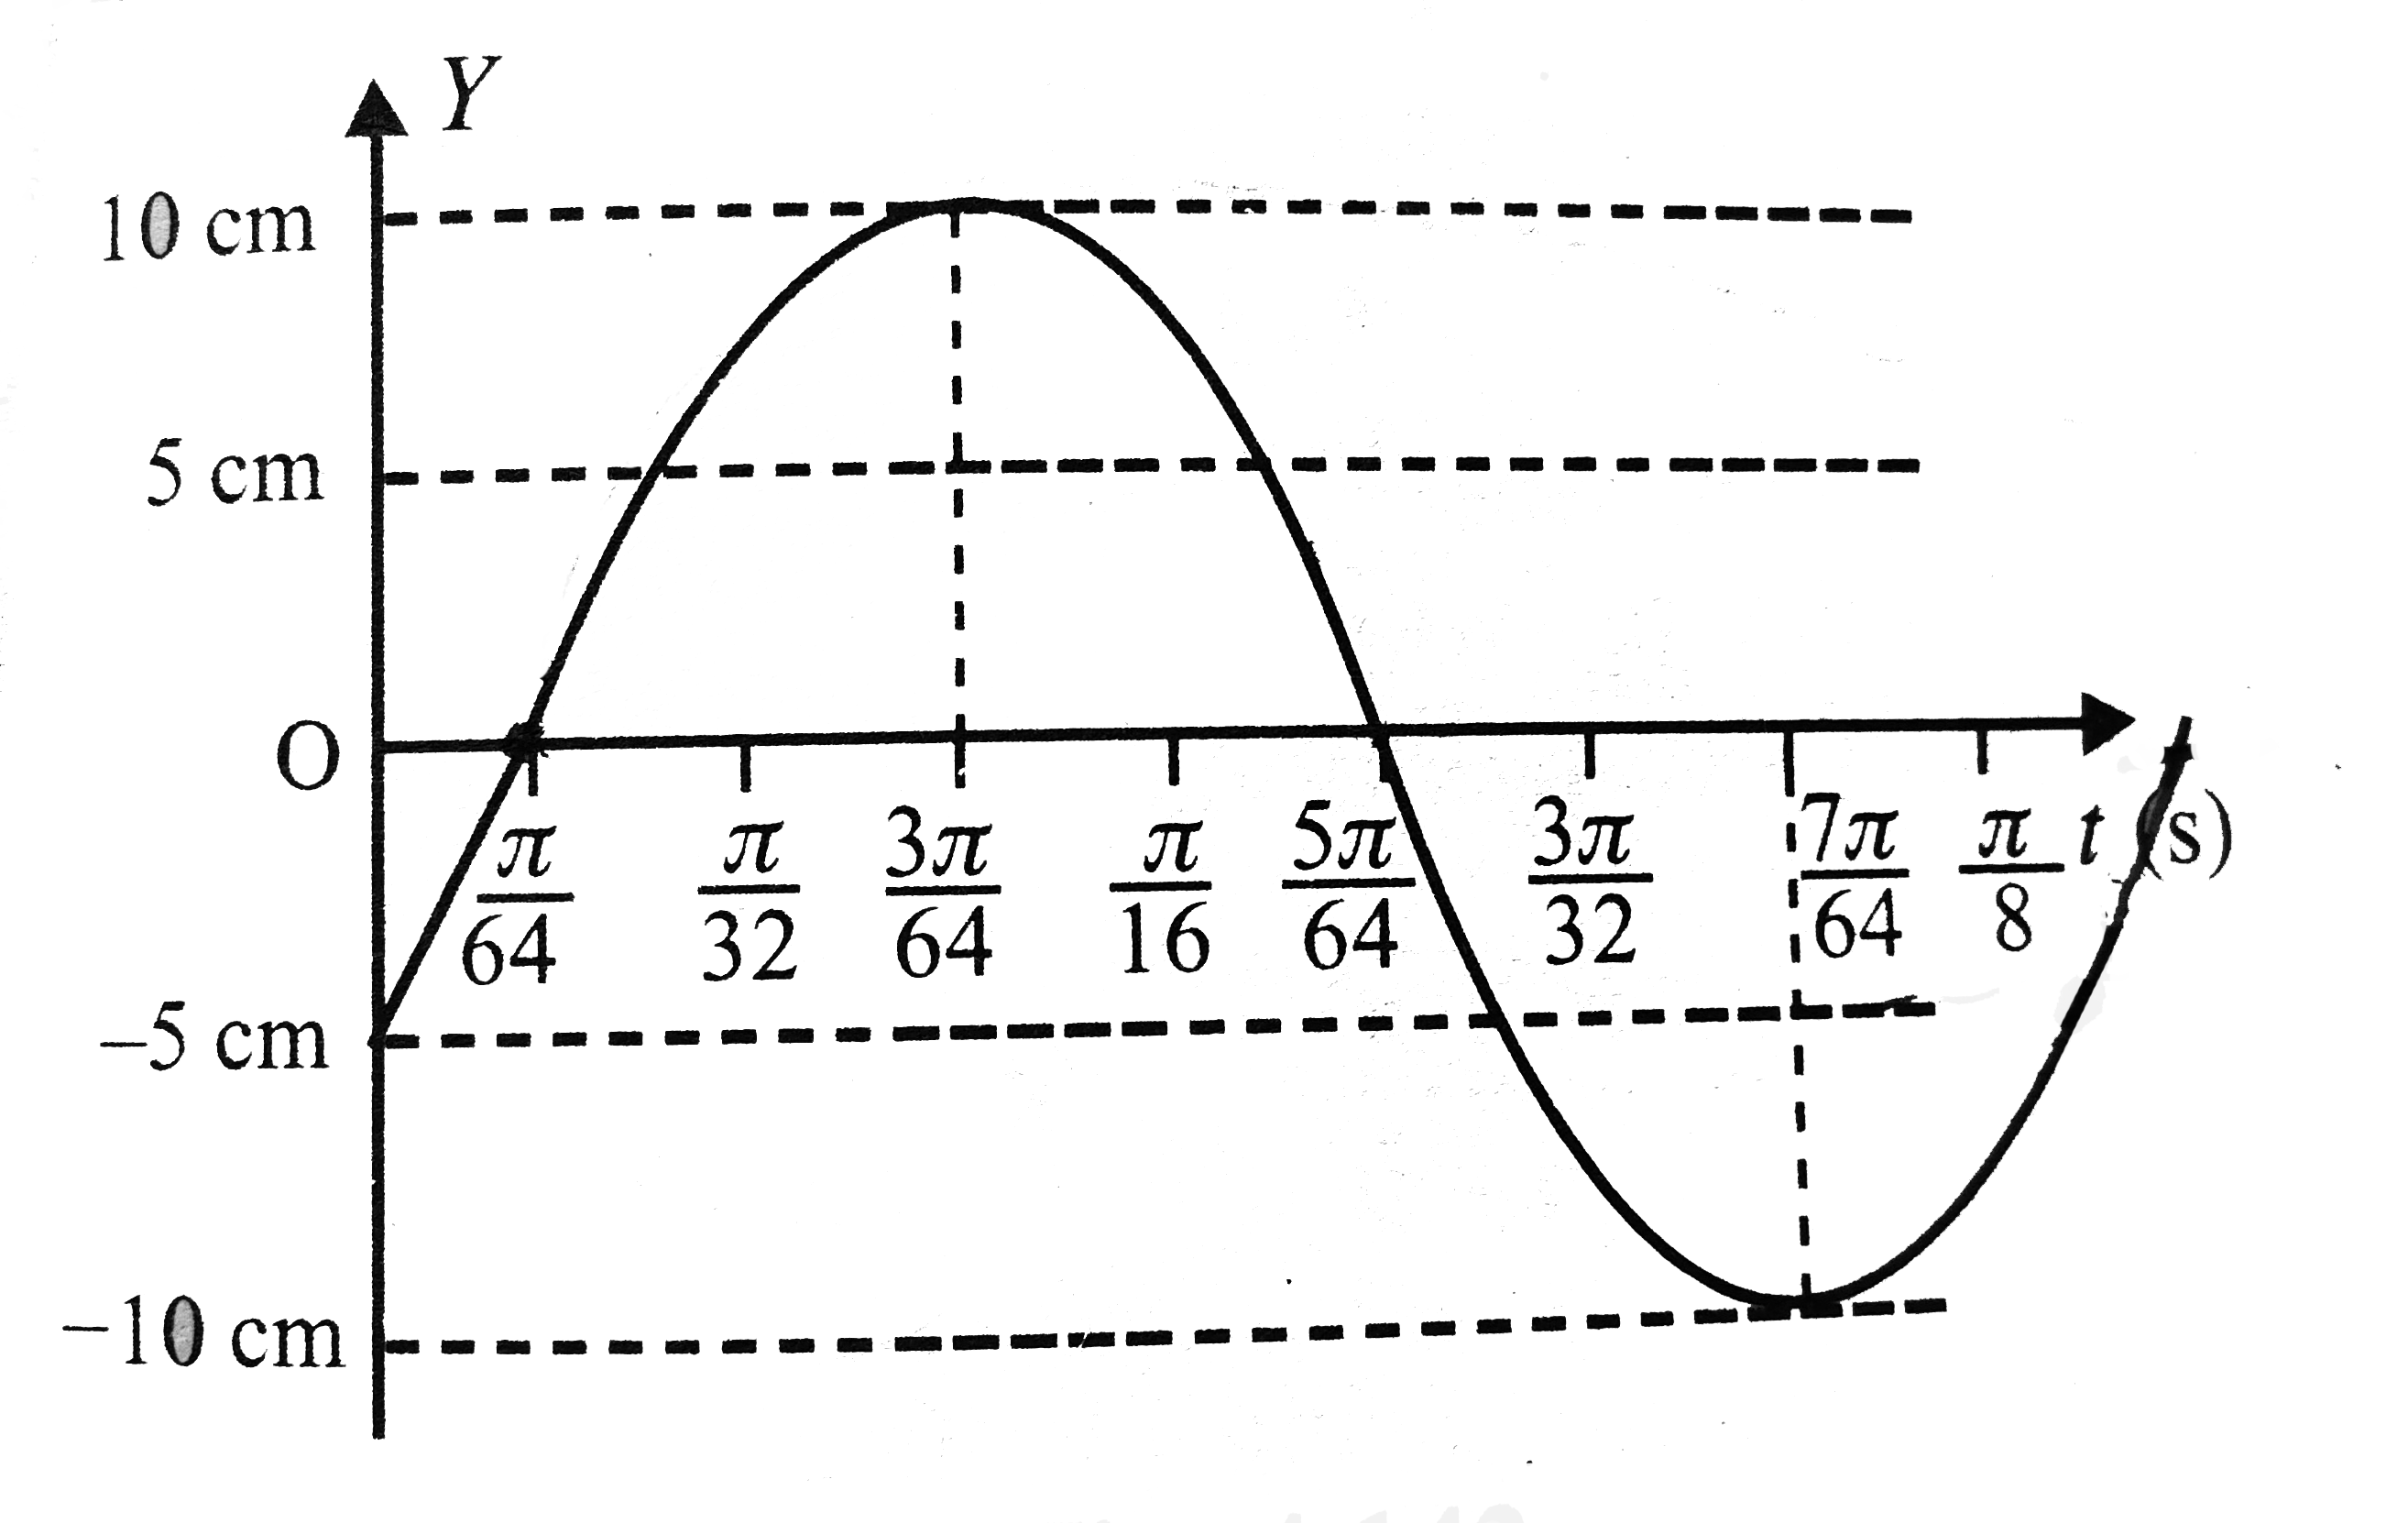
The diagram below shows a sinusoidal curve. The equation of the curve will beView SolutionThe hyperbolic equation for the species area relationship is
View SolutionWhat is an ohmic resistor ? Give one example of an ohmic resistor. Draw a graph to show its currentvoltage relationship. How is the resistance of the resistor determined from this graph ?
View SolutionWrite the equation of the normal to the curve y=x+sinxcosx at x=π2 .
View Solution

