Which of the following best illustrates feedback in development ?
As tissue (X) develops, it secretes something that slows down the growth of tissue (Y)
Tissue (X) secretes RNA which changes the development of tissue (Y)
As tissue (X) develops, it secretes enzymes that inhibit the development of tissue (Y)
As tissue (X) develops, it secretes something that induces tissue (Y) to develop
The correct Answer is:D
Feedback in development is mainly induction by developed tissue to form another tissue
Topper's Solved these Questions
- BOOK - VMC MODULES ENGLISHCHAPTER - HUMAN REPRODUCTION EXERCISE - PRACTICE EXERCISE9videos
HUMAN REPRODUCTION
- BOOK - VMC MODULES ENGLISHCHAPTER - HUMAN REPRODUCTION EXERCISE - IN-CHAPTER EXERCISE-A10videos
HUMAN REPRODUCTION
- BOOK - VMC MODULES ENGLISHCHAPTER - HUMAN REPRODUCTION EXERCISE - IN-CHAPTER EXERCISE-C10videos
HUMAN REPRODUCTION
- BOOK - VMC MODULES ENGLISHCHAPTER - HUMAN HEALTH AND DISEASEEXERCISE - IMPECCABLE54videos
HUMAN HEALTH AND DISEASE
- BOOK - VMC MODULES ENGLISHCHAPTER - MICROBES IN HUMAN WELFAREEXERCISE - IN - CHAPTER EXERCISE - B19videos
MICROBES IN HUMAN WELFARE
Similar Questions
Knowledge Check
- Question 1 - Select One
Which of the following best illustrates the idea of increasing levels of organizational complexity ?
ATissue, chemical, cellular, organ, system, organismicBCellular, chemical, tissue, organismic, organ, systemCChemical, cellular, tissue, organ, system, organismicDChemical, tissue, cellular, organ, organismic, system - Question 2 - Select One
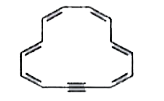
Which of the following may best be called aromatic ?
A B
B C
C D
D
- Question 3 - Select One
Which of the following declarations illustrate function overloading
Aint callme(int,int) , int callme(int,float)Bfloat callme(int,int) , int callme(int,int)Cint callme(int,int), int callme(int,int,intDBoth a and c
Which of the following is the best imbibant ?
View SolutionNegative feedback
View SolutionWhich of the following best describes the picture:
 View Solution
Which of the following best describes the picture:
 View Solution
A block of ice, initially at −20∘C, is heated a steady rate until the temperature of the sample reaches 120∘C. Which of the following graphs best illustrates the temperature of the sample as a function of time?
View Solution


