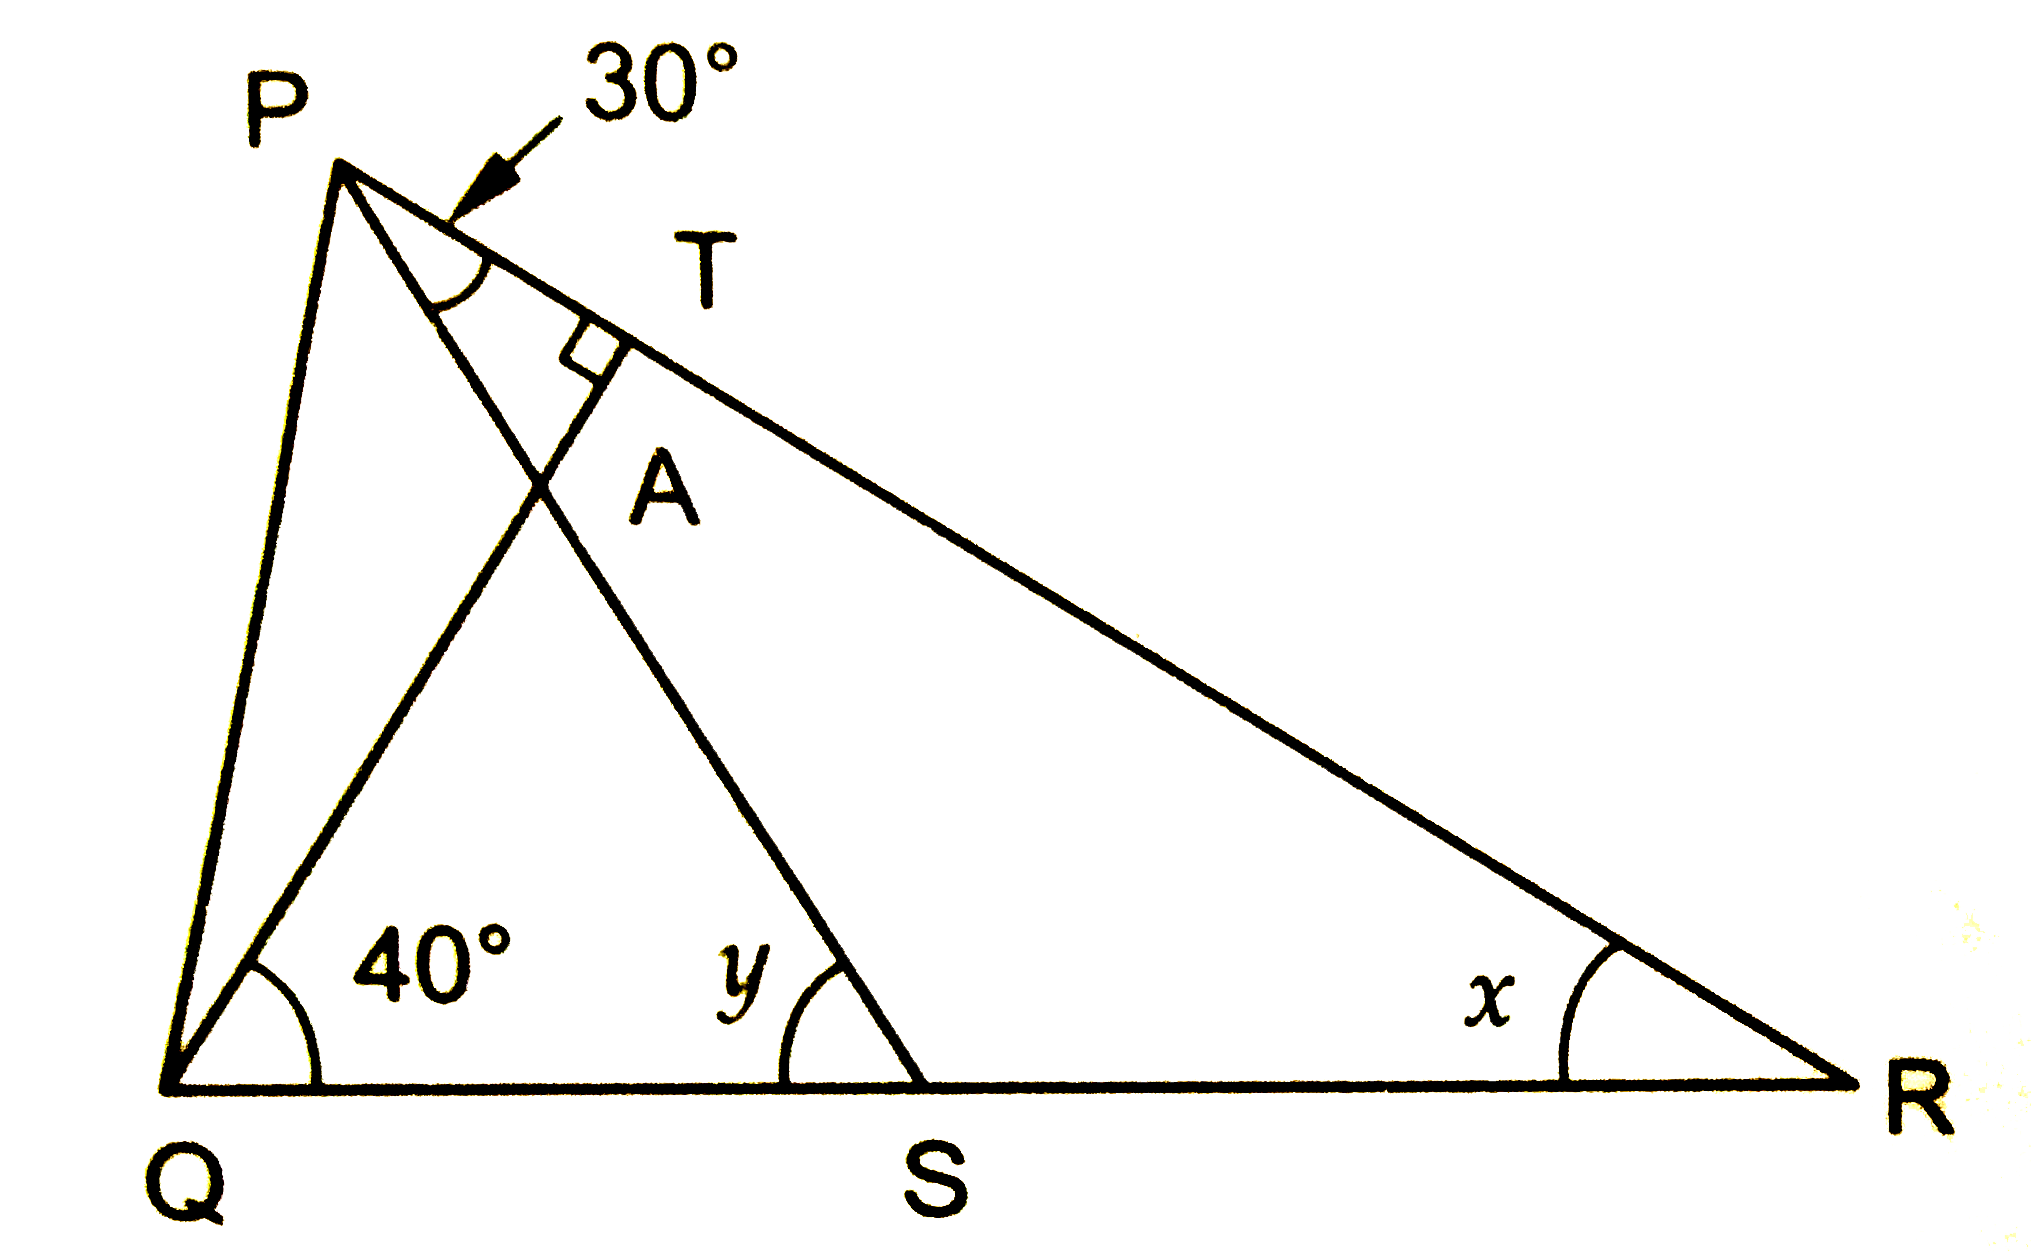
चित्र में, यदि और हों, तो x और y के मान ज्ञात कीजिए ।

The correct Answer is:
Step by step video & image solution for चित्र में, यदि QT _|_ PR, angle TQR = 40^(@) और angle SPR = 30^(@) हों, तो x और y के मान ज्ञात कीजिए । by Maths experts to help you in doubts & scoring excellent marks in Class 9 exams.
Updated on:21/07/2023Topper's Solved these Questions
- रेखाएँ और कोण BOOK - DEEPAK PUBLICATIONCHAPTER - रेखाएँ और कोण EXERCISE - अभ्यास के लिए प्रश्न (रिक्त स्थान भरे)
5 Videos
- रेखाएँ और कोण BOOK - DEEPAK PUBLICATIONCHAPTER - रेखाएँ और कोण EXERCISE - अध्याय का तीव्र अध्ययन
35 Videos
- रेखाएँ और कोण BOOK - DEEPAK PUBLICATIONCHAPTER - रेखाएँ और कोण EXERCISE - परीक्षोपयोगी अन्य महत्वपूर्ण प्रश्न
6 Videos
- रचनाएँ BOOK - DEEPAK PUBLICATIONCHAPTER - रचनाएँ EXERCISE - अध्याय का तीव्र अध्ययन
29 Videos
- वृत्तBOOK - DEEPAK PUBLICATIONCHAPTER - वृत्तEXERCISE - अध्याय का तीव्र अध्ययन
32 Videos
Similar Questions
एक त्रिभुज में…………….से अधिक समकोण नहीं हो सकते है।
View Solutionनिम्नलिखित में से प्रत्येक प्रश्न का उत्तर दीजिए , और कारण भी बताइए :
रेखीय युग्म में से एक कोण न्यूनकोण है, तो दूसरा कोण किस प्रकार का कोण होगा ?
View Solutionसिद्ध कीजिए कि यदि दो रेखाएँ परस्पर प्रतिच्छेद करती हैं तब शीर्षाभिमुख कोण बराबर हैं |
View Solutionनिम्नलिखित कोण का माप होगा -

View Solutionकिसी तल के उन सभी बिन्दुओं के समूह को क्या कहा जाता है जो तल के एक स्थिर बिन्दु से समान दूरी पर हों-
View SolutionHow many lines of symmetry does the above figure have ?
View SolutionWhich of the following are correct chain isomers of butane ? (i)
View SolutionDetermine the point of symmetry of a regular hexagon.
View SolutionDtermine the images of the following figure about the given line :
View SolutionMatch the following Column A to Column B

View SolutionMatch the following Column A to Column B

View SolutionMatch the following Column A to Column B

View SolutionThe inequation represented by the graph given below is :
View SolutionThe inequation that best describes the graph given below is _________
View SolutionThe inequation that best describes the following graph is _________
View SolutionWhich inequations represent the shaded region in the given figure
View Solution
