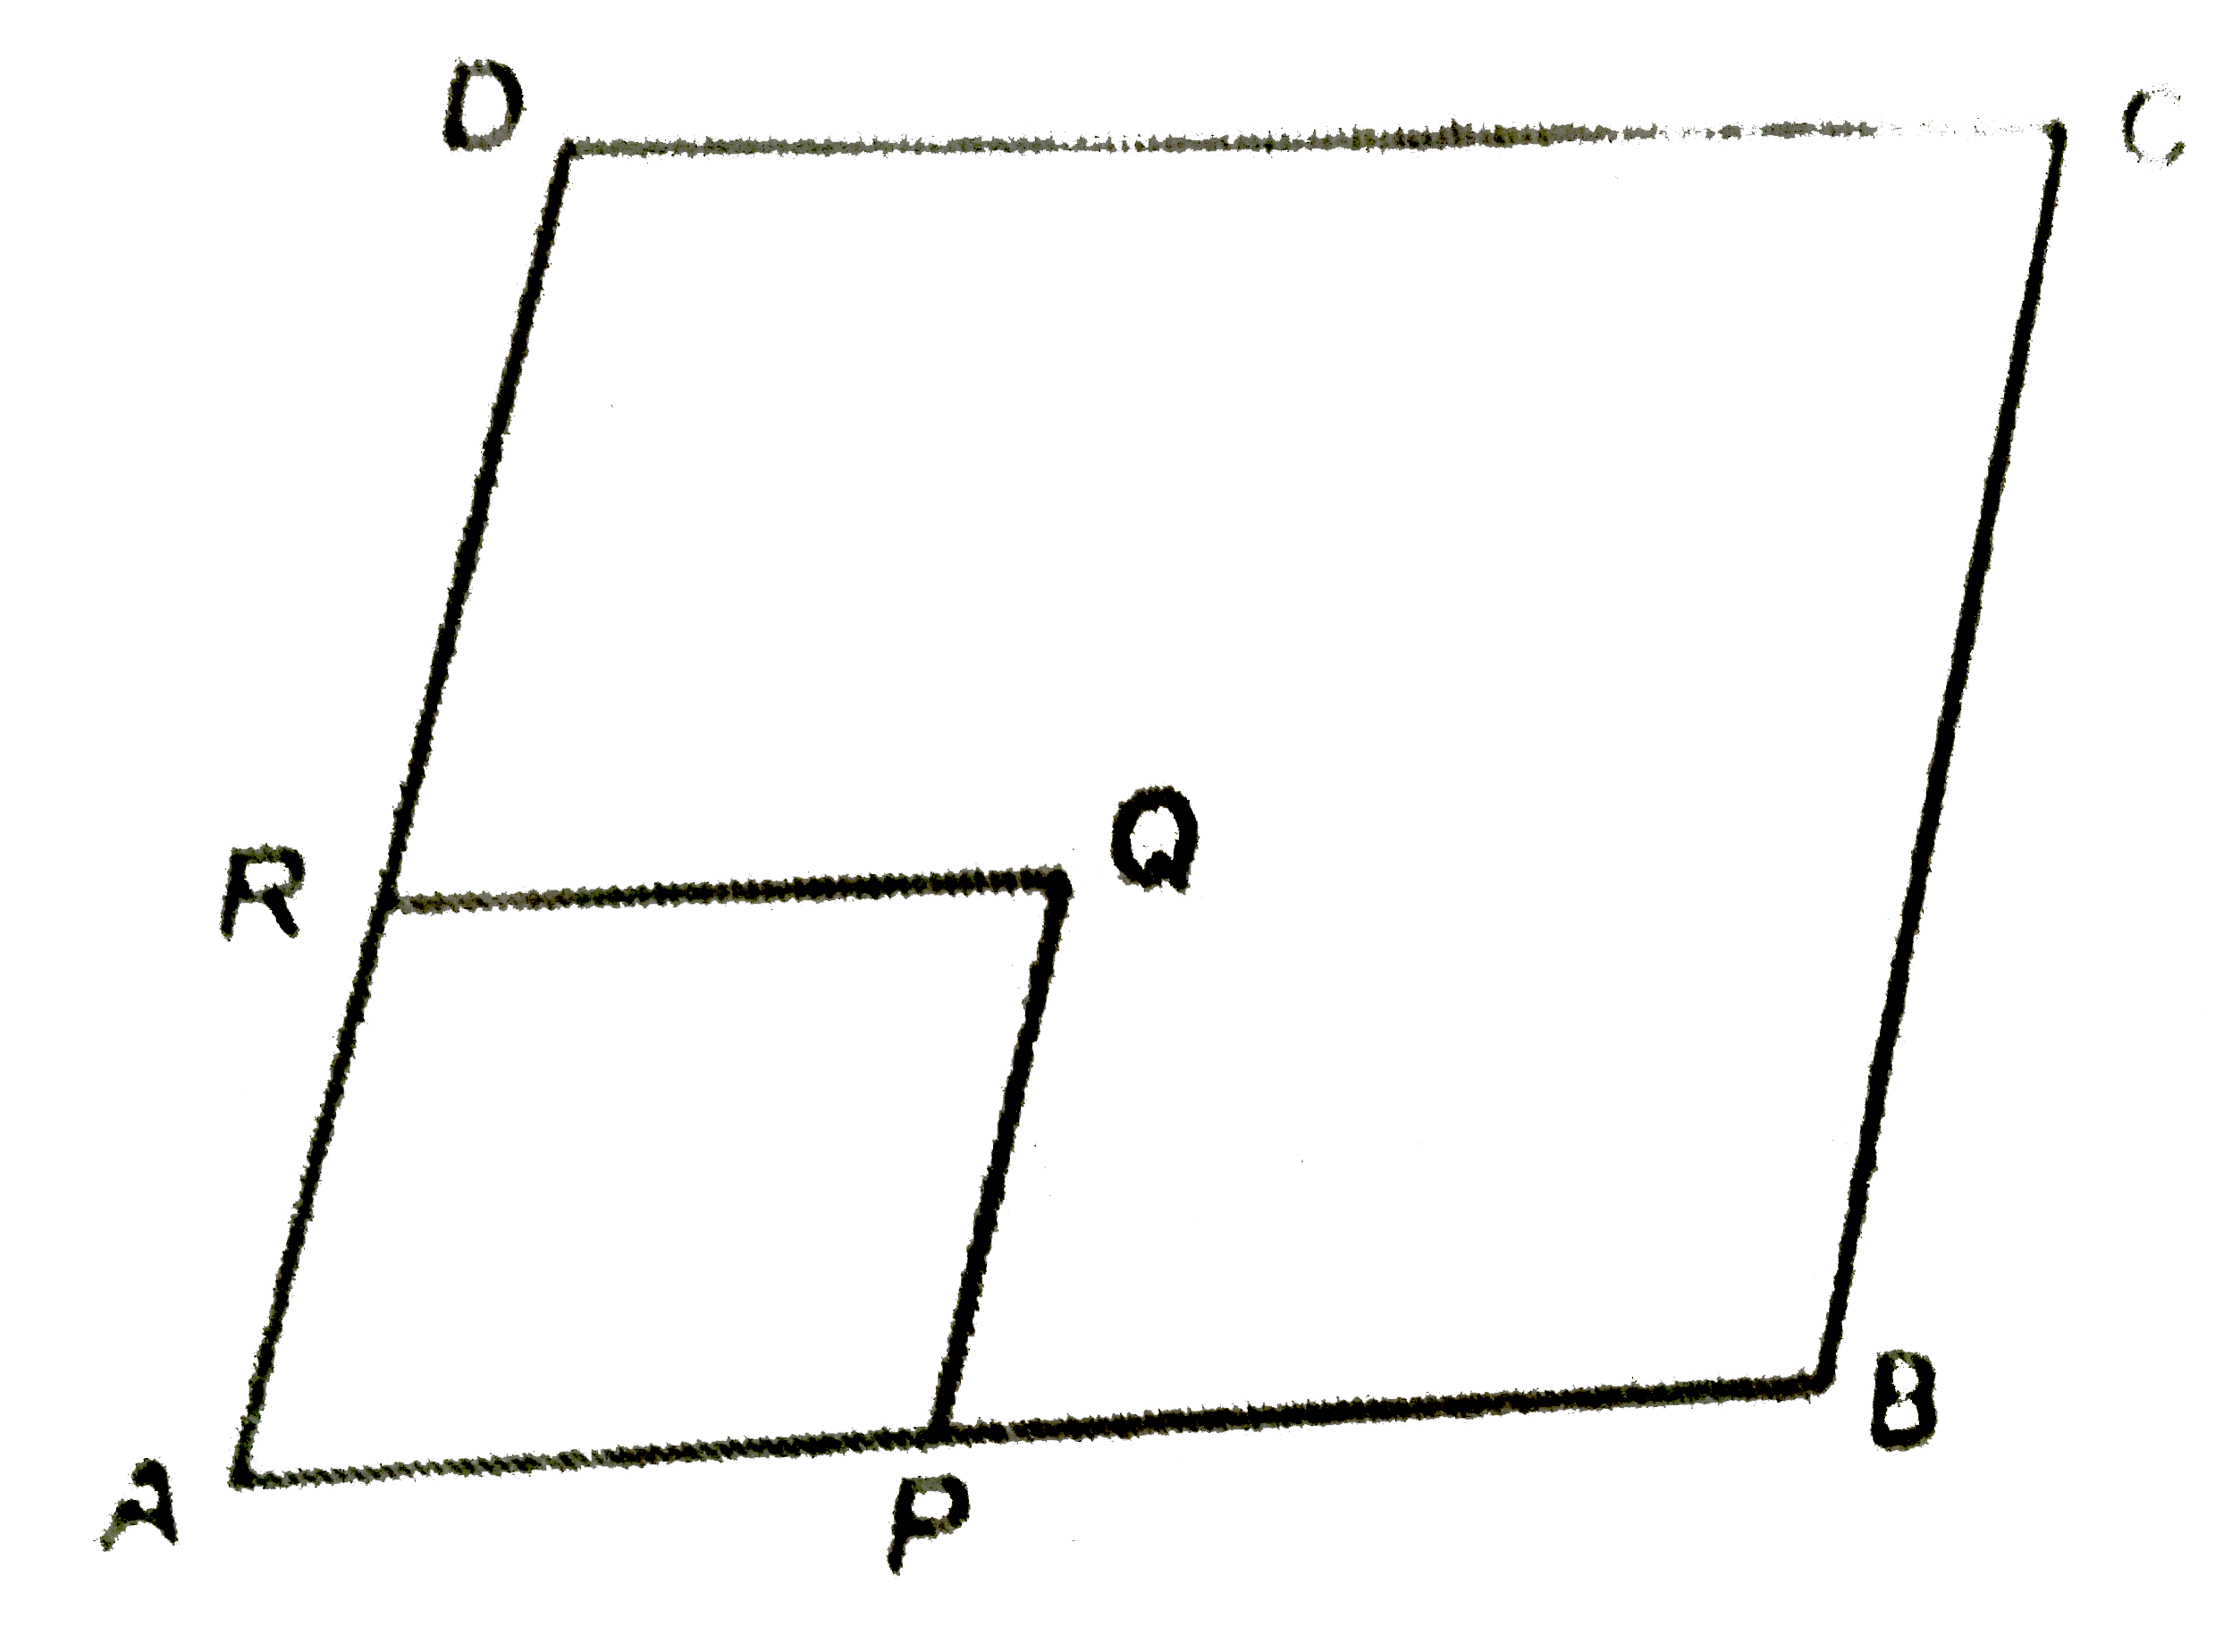
In the adjoining figure, □ABCDand□APQR are two parallelograms. Prove that :
∠C=∠Qand∠B=∠R

□APQR is a parallelogram
∴ ∠A=∠Q(opposite∠sare equal)...(1)
□ABCD is a parallclogram
∴ ∠A=∠C (opposite∠sare equal) ...(2)
From (1) and (2)
∠C=∠Q ...(3)
Again, □ABCD is a parallelogram
∴ ∠B+∠C=180∘ (sum of co-interior angles)
⇒ ∠C=180∘−∠B ...(4)
and □APQR is a parallelogram
∴ ∠Q+∠R=180∘ (sum of co-interior angles)
⇒ ∠Q+=180∘−∠R ...(5)
From (3), (4) and (5), we get
180∘−∠R=180∘−∠B
⇒ ∠B=∠R
∴ ∠C=∠Qand∠B=∠R
Topper's Solved these Questions
- BOOK - NAGEEN PRAKASHAN ENGLISHCHAPTER - QUADRILATERALSEXERCISE - Problems From NCERT/exemplar11videos
QUADRILATERALS
- BOOK - NAGEEN PRAKASHAN ENGLISHCHAPTER - QUADRILATERALSEXERCISE - Exercise 8a29videos
QUADRILATERALS
- BOOK - NAGEEN PRAKASHAN ENGLISHCHAPTER - PROBABILITYEXERCISE - Revision Exercise (very Short Answer /short Answer Questions)10videos
PROBABILITY
- BOOK - NAGEEN PRAKASHAN ENGLISHCHAPTER - STATISTICSEXERCISE - Revision Exercise12videos
STATISTICS
Similar Questions
Show that if the diagonals of a quadrilateral bisect each other at right angles, then it is a rhombus.
04:05View SolutionThe angles of a quadrilateral are 89∘and113∘ If the other two angles are equal, find the equal angles.
01:37View SolutionWhat is the probability of an impossible event?
02:11View SolutionIf the heights of 5 persons are 140 cm, 150 cm, 152 cm, 158 cm and 161 cm respectively, find the mean height.
01:31View SolutionIn the adjoining figure, □ABCDand□APQR are two parallelograms. Prove that :
∠C=∠Qand∠B=∠R
 02:45View Solution
How many lines of symmetry does the above figure have ?
02:17View SolutionDetermine the point of symmetry of a regular hexagon.
05:41View SolutionDtermine the images of the following figure about the given line :
02:21View SolutionMatch the following Column A to Column B
 02:03View Solution
Match the following Column A to Column B
 02:10View Solution
Match the following Column A to Column B
 02:17View Solution
Find the area of the figure given below.
 02:10View Solution
The area of the shaded part in the figure given below is ______.
 04:23View Solution
The inequation represented by the graph given below is :
01:59View SolutionThe inequation that best describes the graph given below is _________
01:19View SolutionThe inequation that best describes the following graph is _________
01:52View Solution

