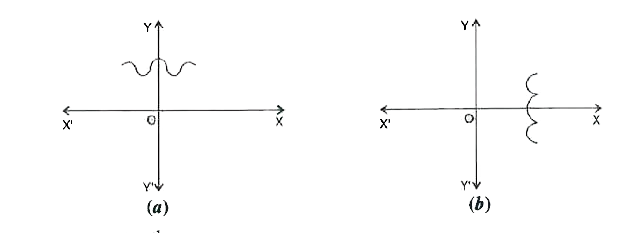
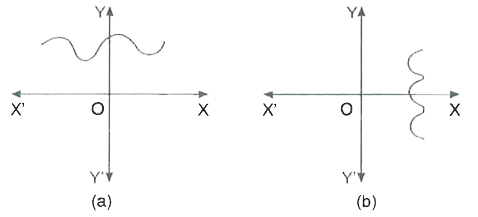
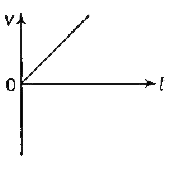
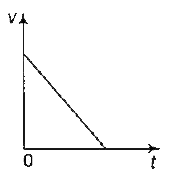
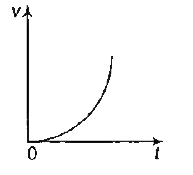
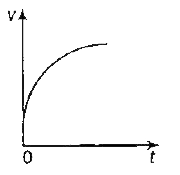
Which of the following graphs represents the speed v of a projectile as a function of time?
A
B
C
D
Text Solution
The correct Answer is:B
In a projectile motion, speed (v) of a projectile decreases with time (t). Hence, graph in option (b) is correct.
|
Similar Questions
Knowledge Check
Which of the following I-V graph represents ohmic conductors?
A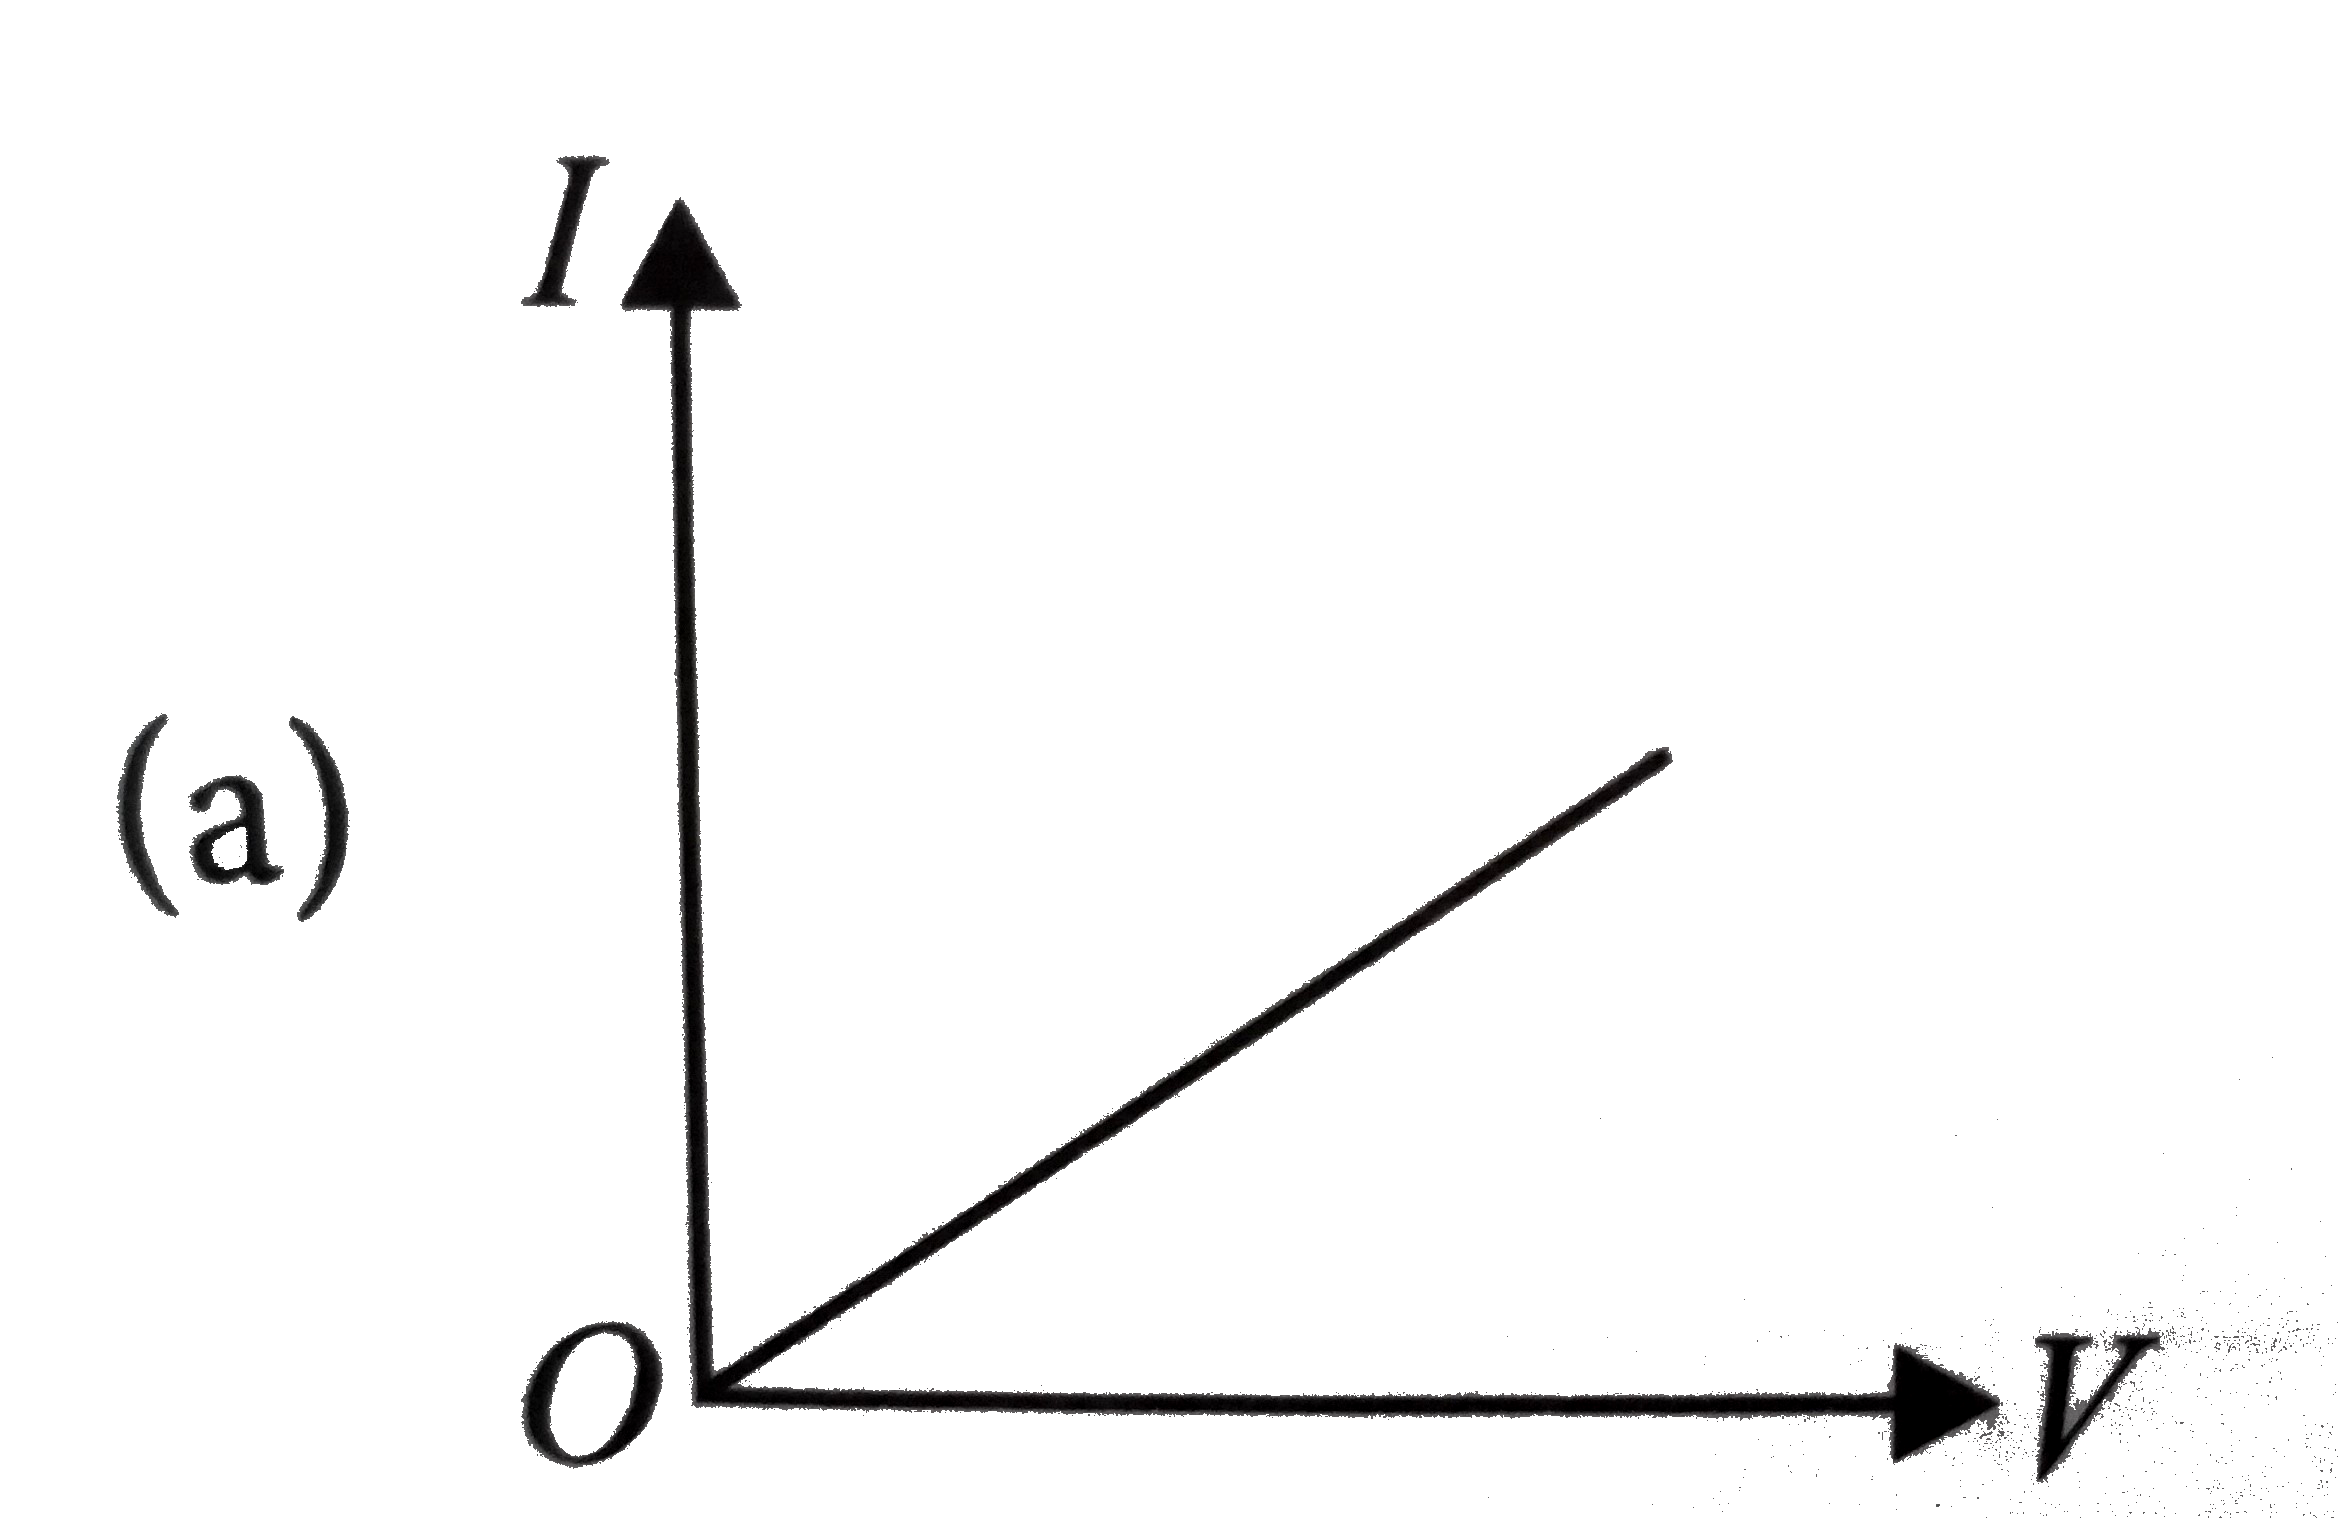 B
B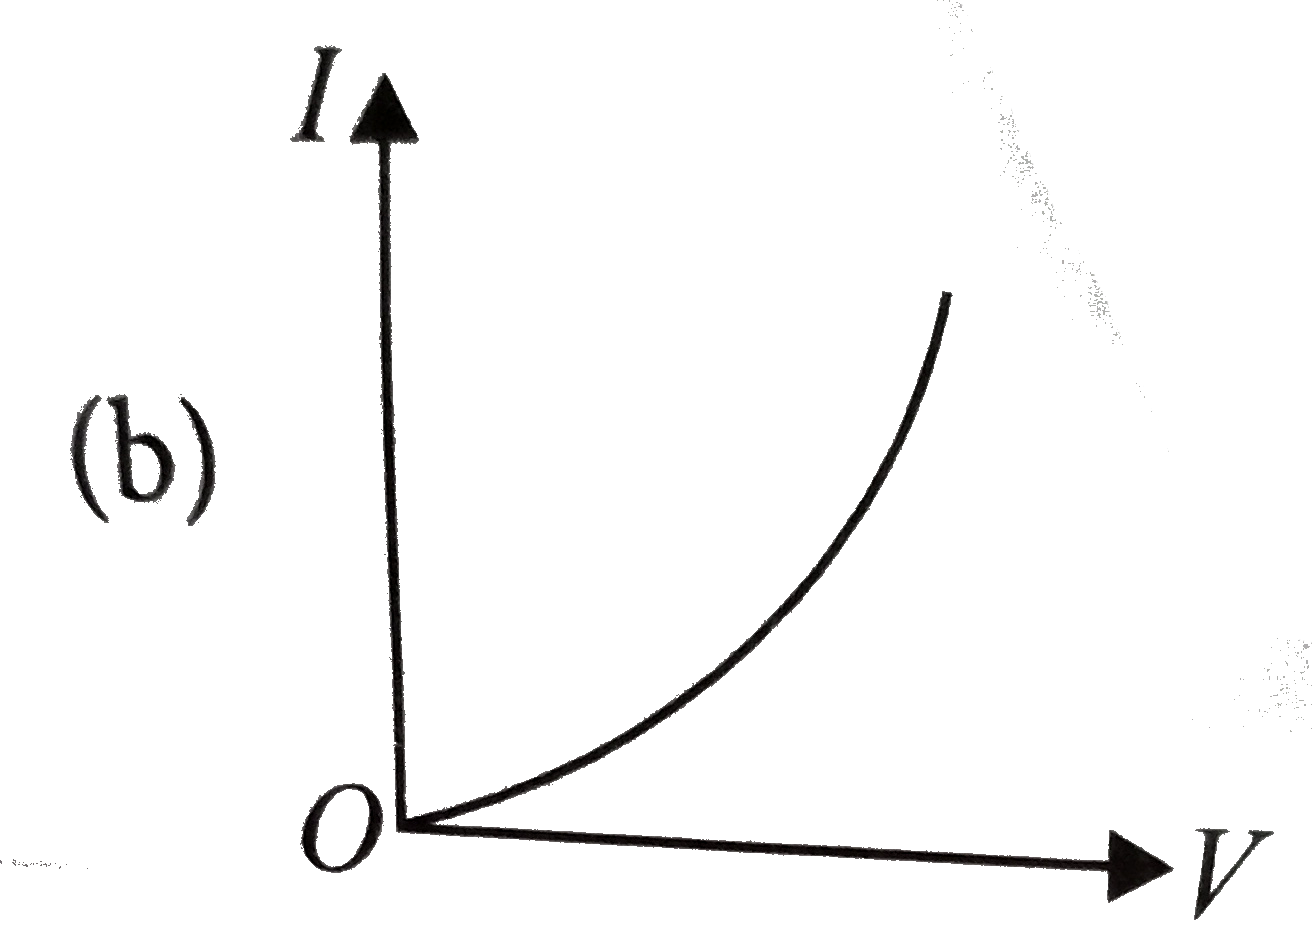 C
C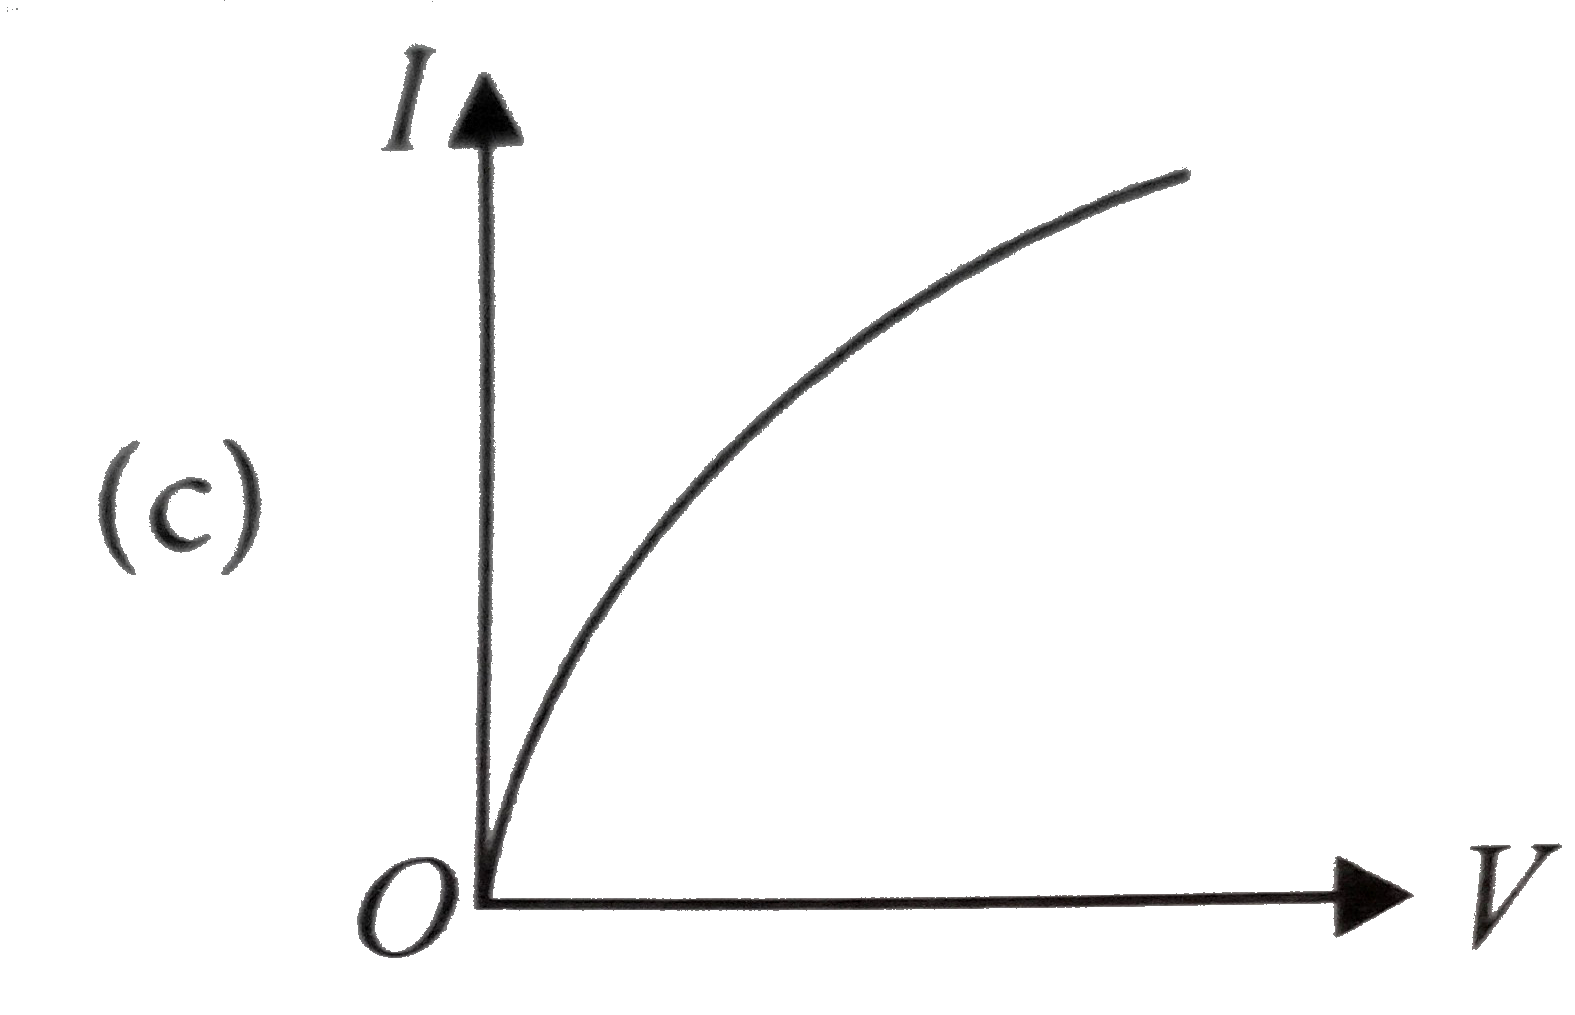 D
D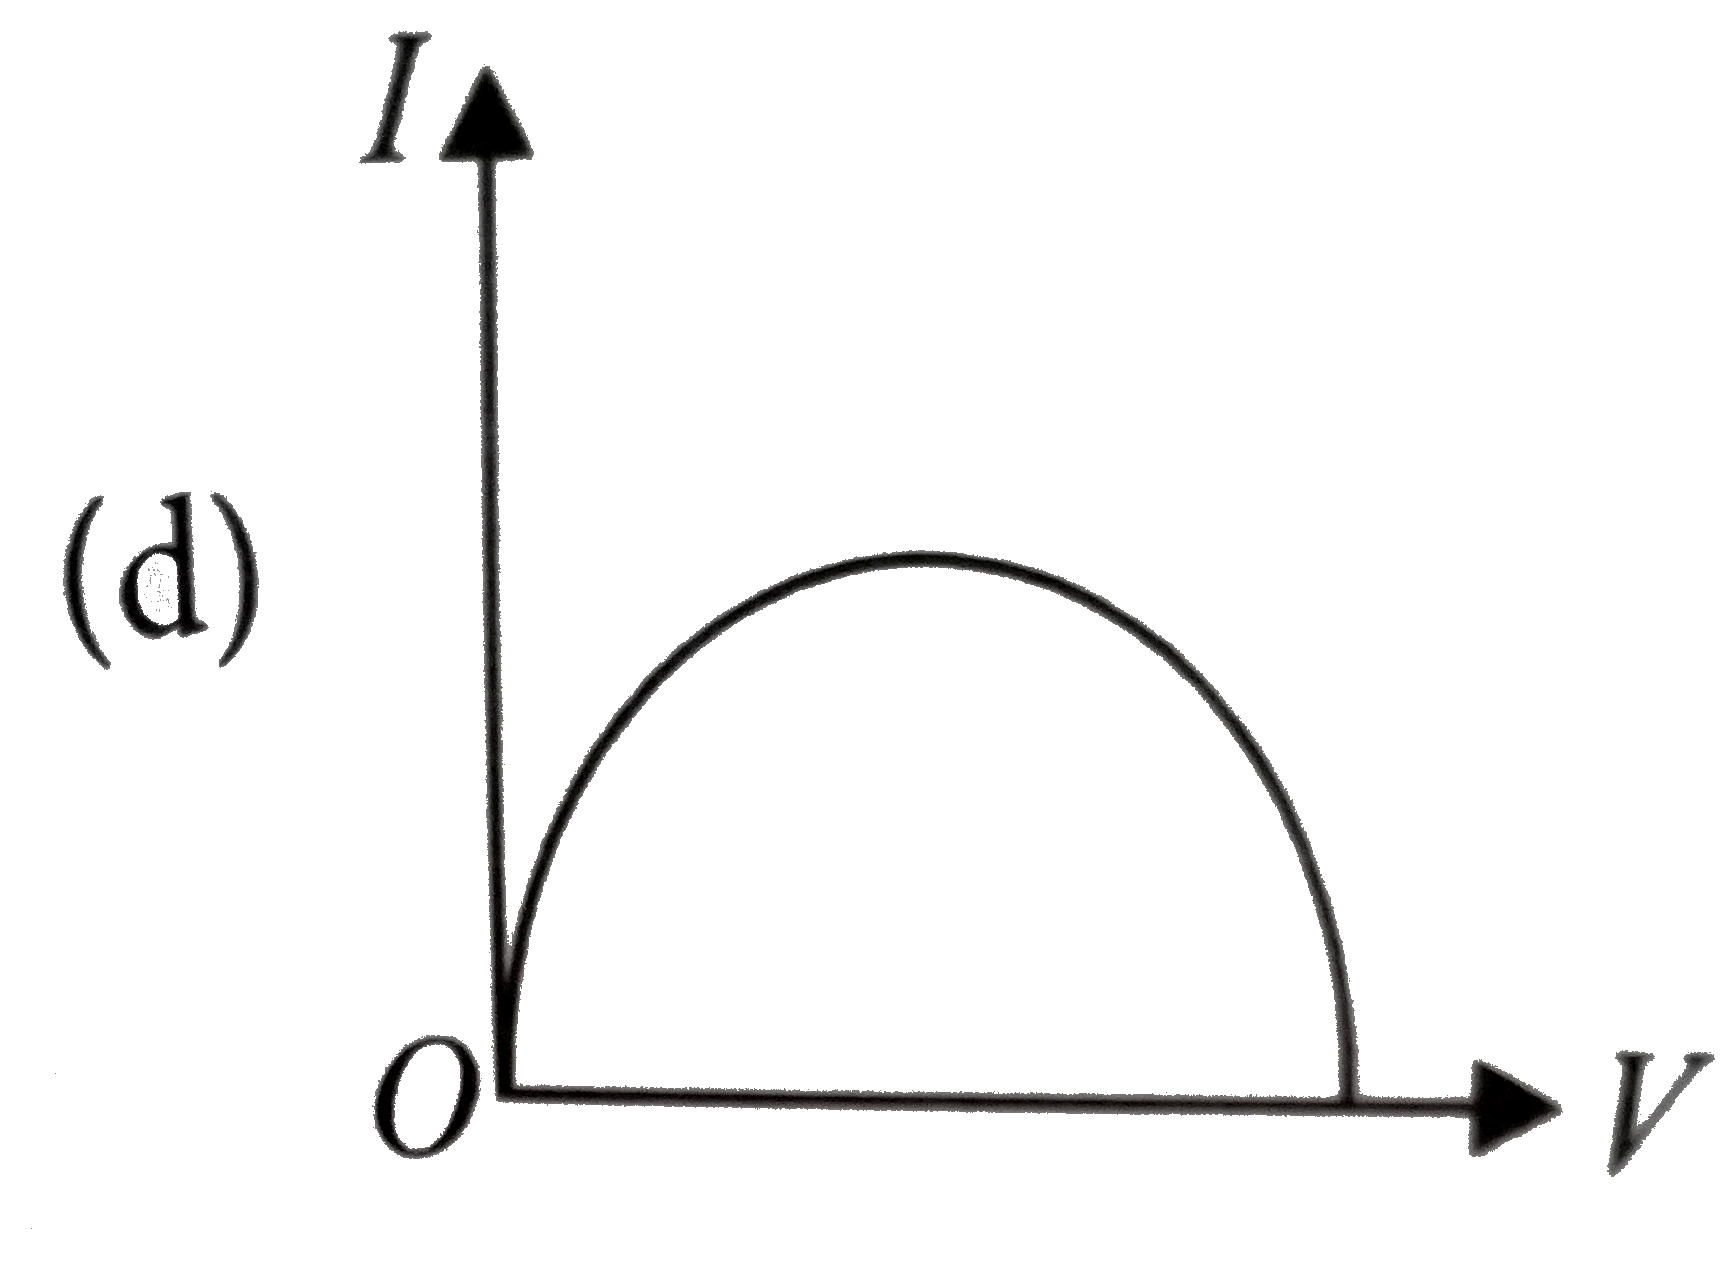
Which of the following I-V graph represents ohmic conductors?
A B
B C
C D
D
The graph below shws the velocity versus time graph for a body
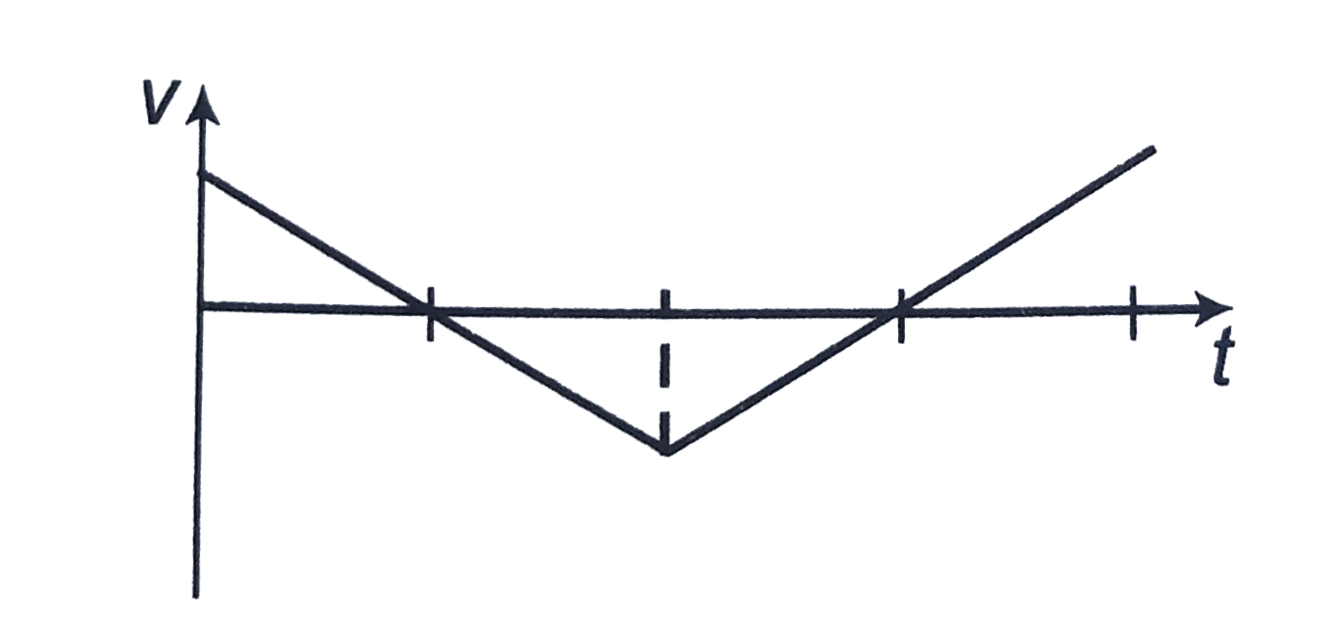
Which of the following graph represents the corresponding acceleration v//s time graph?A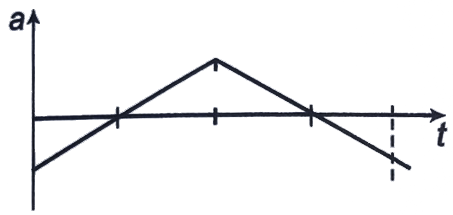 B
B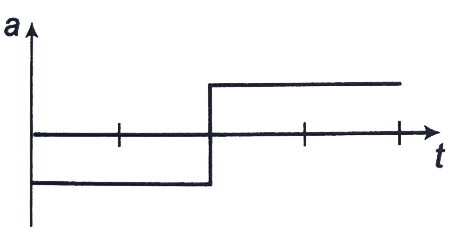 C
C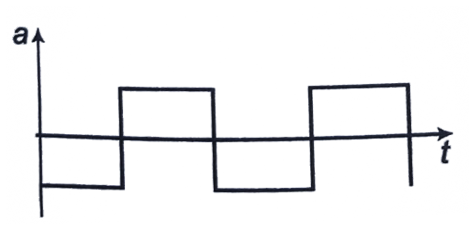 D
D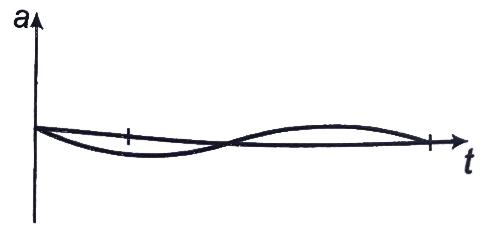
The graph below shws the velocity versus time graph for a body

Which of the following graph represents the corresponding acceleration v//s time graph?
View SolutionThe graph shown the variation with times t of the velocity v of an object . Which one of the following graphs best represents the variation of acceleration a of the object with time t?

View SolutionThe graph shown the variation with times t of the velocity v of an object . Which one of the following graphs best represents the variation of acceleration a of the object with time t?

View SolutionWhich of the following P-V diagram represent the graph of isometric process?
View SolutionWhich of the following P-V diagram represent the graph of isometric process?
View Solution

