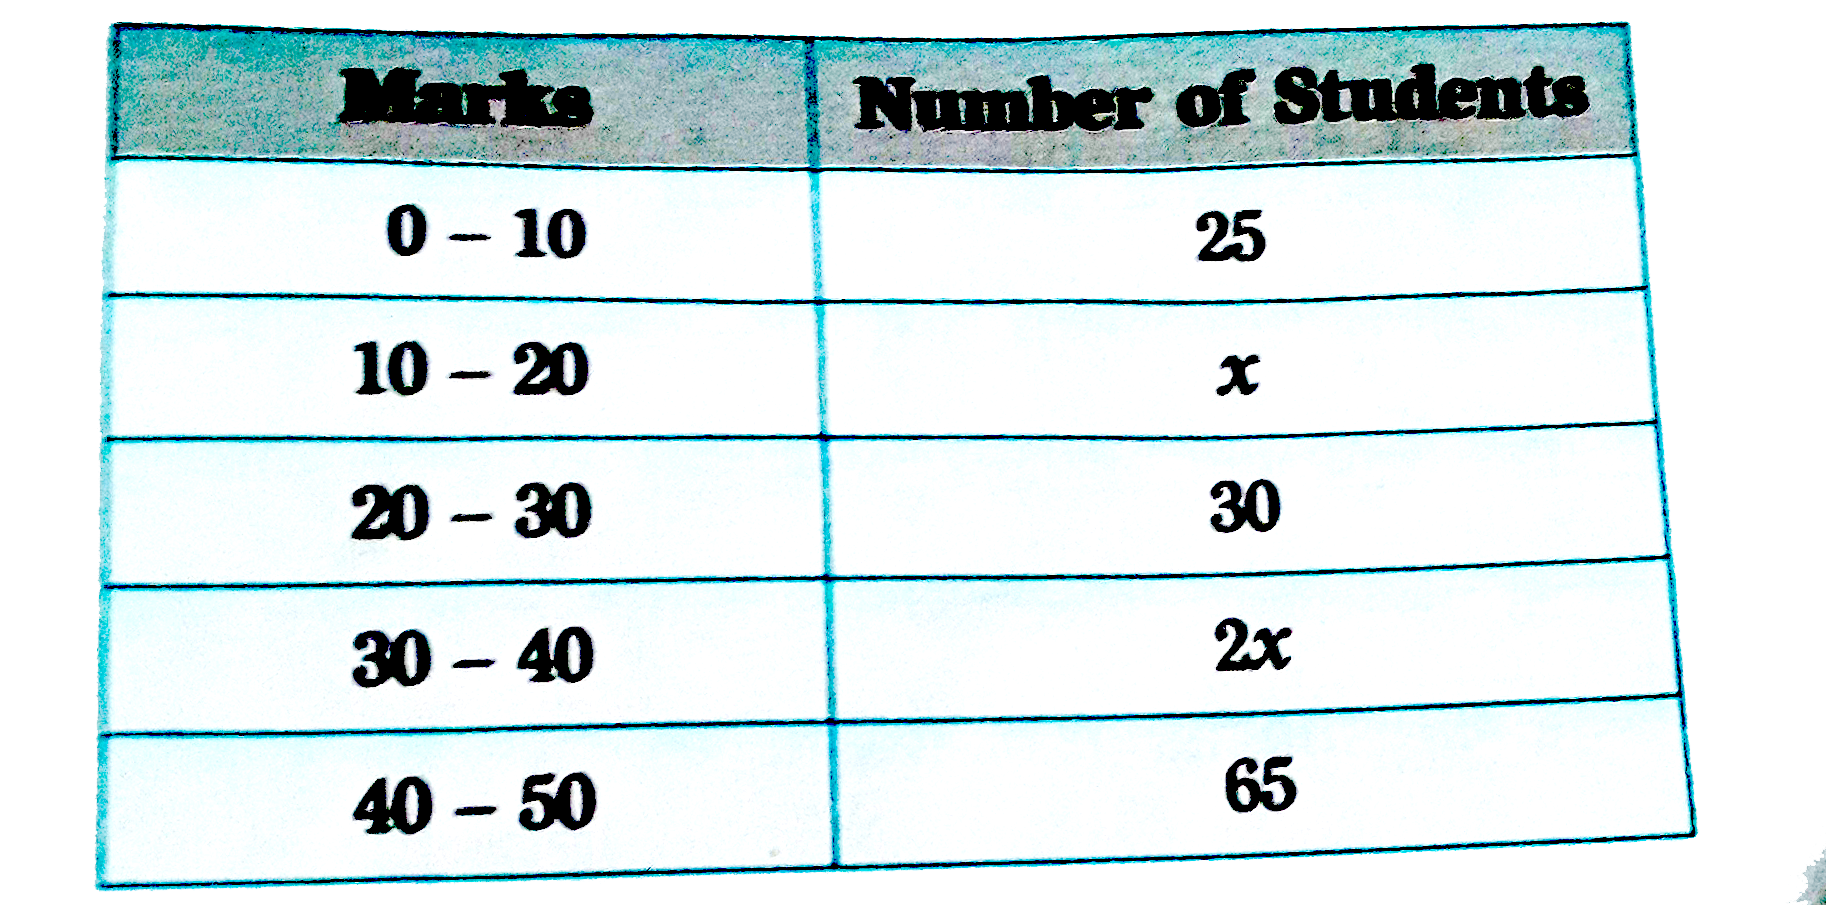
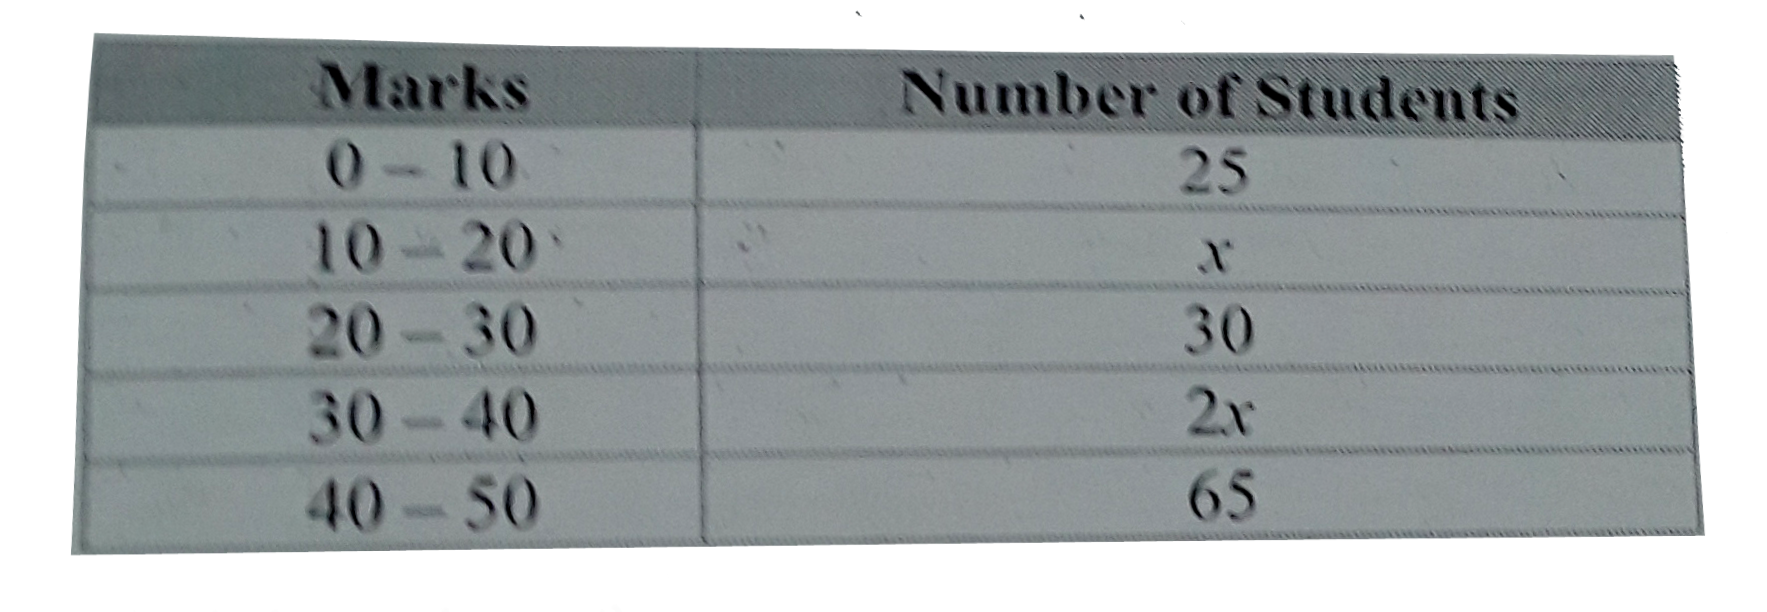
The following frequency distribution table shows marks obtained by 180 students in Mathematics examination :

Find the value of x.
Also draw a histogram representing the above informations.
The correct Answer is:x=20
Step by step video & image solution for The following frequency distribution table shows marks obtained by 180 students in Mathematics examination : Find the value of x. Also draw a histogram representing the above informations. by Maths experts to help you in doubts & scoring excellent marks in Class 10 exams.
Updated on:21/07/2023Topper's Solved these Questions
Similar Questions
Knowledge Check
If for somes x∈R the frequency distribution of marks obtained by 20 students in a test is:

Then the mean of the marks is:A2.5B3.0C2.8D3.2The table shows the marks obtained by 25 students in a class test. Find the mean of the marks obtained
 A7.72B7.65C7.4D7
The following distribution table shows the marks scored by 140 students in an examination :

Calculate the mode of the distribution.
View SolutionIf for somex∈R, the frequency distribution of the marks obtained by 20 students in a test is:

Then the mean of the marks is:
View SolutionThe marks scored by students in Mathematics in a certain examinations are given below:

Draw histogram for the above data.
View SolutionThe marks scored by students in Mathematics in a certain examinations are given below:

Draw histogram for the above data.
View SolutionThe following table represent marks obtained by 100 students in a test.

Find mean marks of the students.
View SolutionThe frequency distribution of marks obtained by students in a class test is given below .
Draw frequency polygon and ogive.

View Solution


