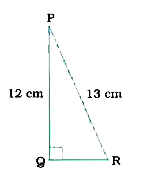
In the given figure, find tan P - cot R.
 Solution in Gujrati
Step by step video & image solution for In the given figure, find tan P - cot R. by Maths experts to help you in doubts & scoring excellent marks in Class 10 exams.
Updated on:21/07/2023Topper's Solved these Questions
- INTRODUCTION TO TRIGONOMETRYBOOK - KUMAR PRAKASHANCHAPTER - INTRODUCTION TO TRIGONOMETRYEXERCISE - EXERCISE 8.2
15 Videos
- INTRODUCTION TO TRIGONOMETRYBOOK - KUMAR PRAKASHANCHAPTER - INTRODUCTION TO TRIGONOMETRYEXERCISE - EXERCISE 8.3
11 Videos
- INTRODUCTION TO TRIGONOMETRYBOOK - KUMAR PRAKASHANCHAPTER - INTRODUCTION TO TRIGONOMETRYEXERCISE - Practice Thoroughly
19 Videos
- COORDINATE GEOMETRYBOOK - KUMAR PRAKASHANCHAPTER - COORDINATE GEOMETRYEXERCISE - Objective Questions (True or false)
5 Videos
- PAIR OF LINEAR EQUATIONS IN TWO VARIABLES BOOK - KUMAR PRAKASHANCHAPTER - PAIR OF LINEAR EQUATIONS IN TWO VARIABLES EXERCISE - Test Your Skills
48 Videos
Similar Questions
Evaluate the following :
sin60∘cos30∘+sin30∘cos60∘
View SolutionEvaluate:
sin18∘cos72∘
View SolutionIf θ=45°, find the value of 2cosec2θ+3sec2θ.
View SolutionThe point (0,5), (0,-9) and (3,6) are collinear.
View SolutionIf the numerator of a fraction is decreased by 1. It reduces to 12 and if its numerator is increased by 1. it reduces to 1. Represent this situation algebraically and graphically.
View SolutionHow many lines of symmetry does the above figure have ?
View SolutionDetermine the point of symmetry of a regular hexagon.
View SolutionDtermine the images of the following figure about the given line :
View SolutionMatch the following Column A to Column B

View SolutionMatch the following Column A to Column B

View SolutionMatch the following Column A to Column B

View SolutionFind the area of figure given below.

View SolutionFind the perimeter of the figure given below.

View SolutionFind the area of the figure given below.

View SolutionThe area of the shaded part in the figure given below is ______.

View SolutionThe inequation represented by the graph given below is :
View Solution
