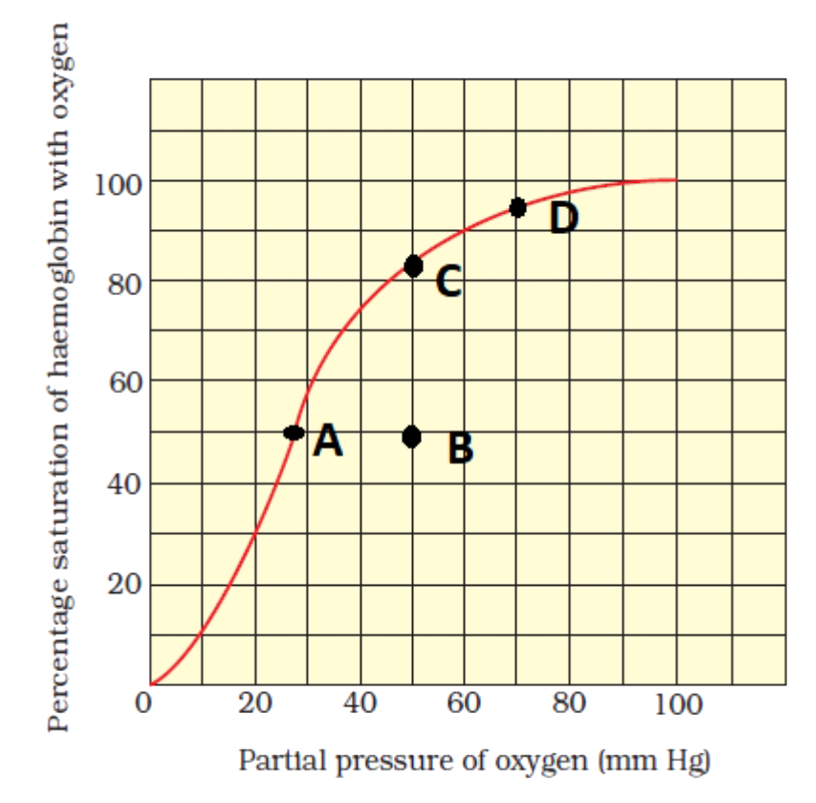
Which of the following point on the oxygen dissociation curve represent p50 of HbO2 in the. graph give below ?

A
A
B
B
C
C
D
D
Video Solution
Text Solution
The correct Answer is:A
|
Answer
Step by step video & image solution for Which of the following point on the oxygen dissociation curve represent p_(50) " of " HbO_2 in the. graph give below ? by Biology experts to help you in doubts & scoring excellent marks in Class 12 exams.
Updated on:21/07/2023Similar Questions
Knowledge Check
Which of the following causes a leftward shift in the oxygen dissociation curve?
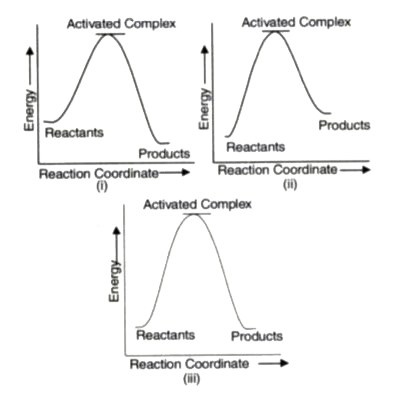
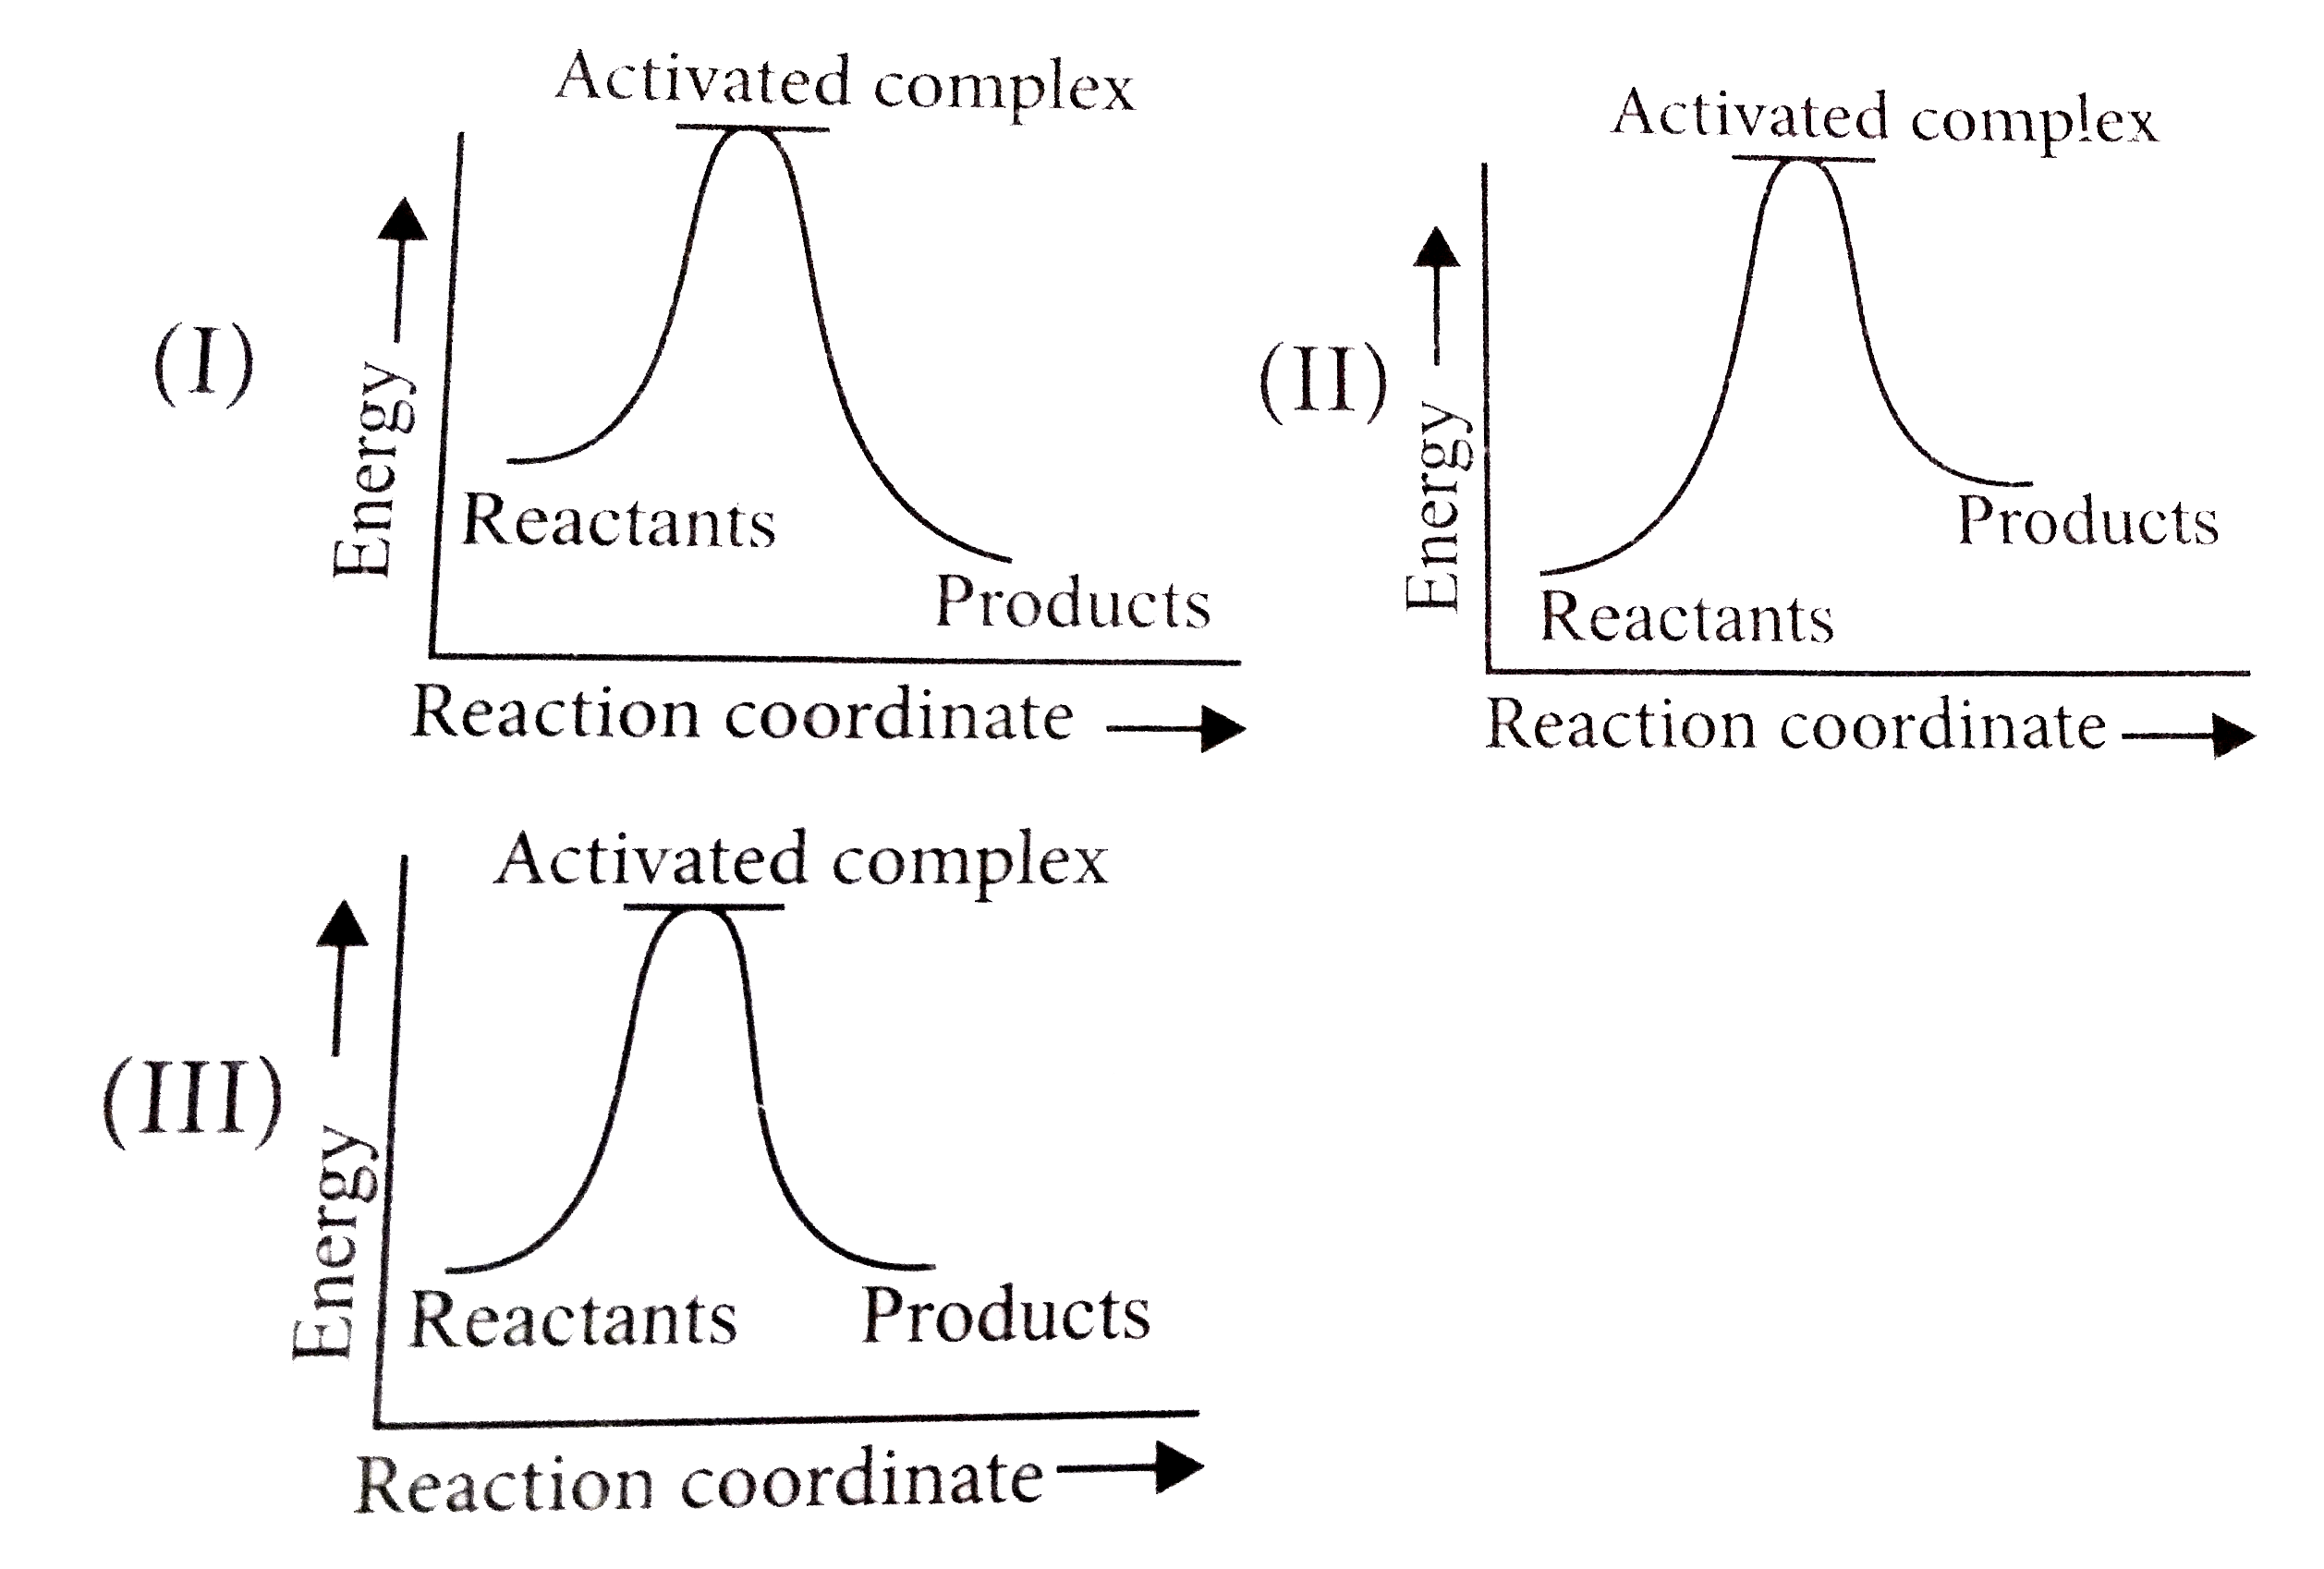
AIncreased carbon dioxide concentrationBAn increase in hydrogen ion concentrationCA decrease in pHDAll of the aboveWhich of the following graphs represents exothermic reaction ?
 A(i) onlyB(ii) onlyC(iii) onlyD(i) and (ii)
Which of the following graphs represents exothermic reaction ?
 A(i) onlyB(ii) onlyC(iii) onlyD(i) and (ii)
Which of the following is the graph of the curve √|y|=x is ?
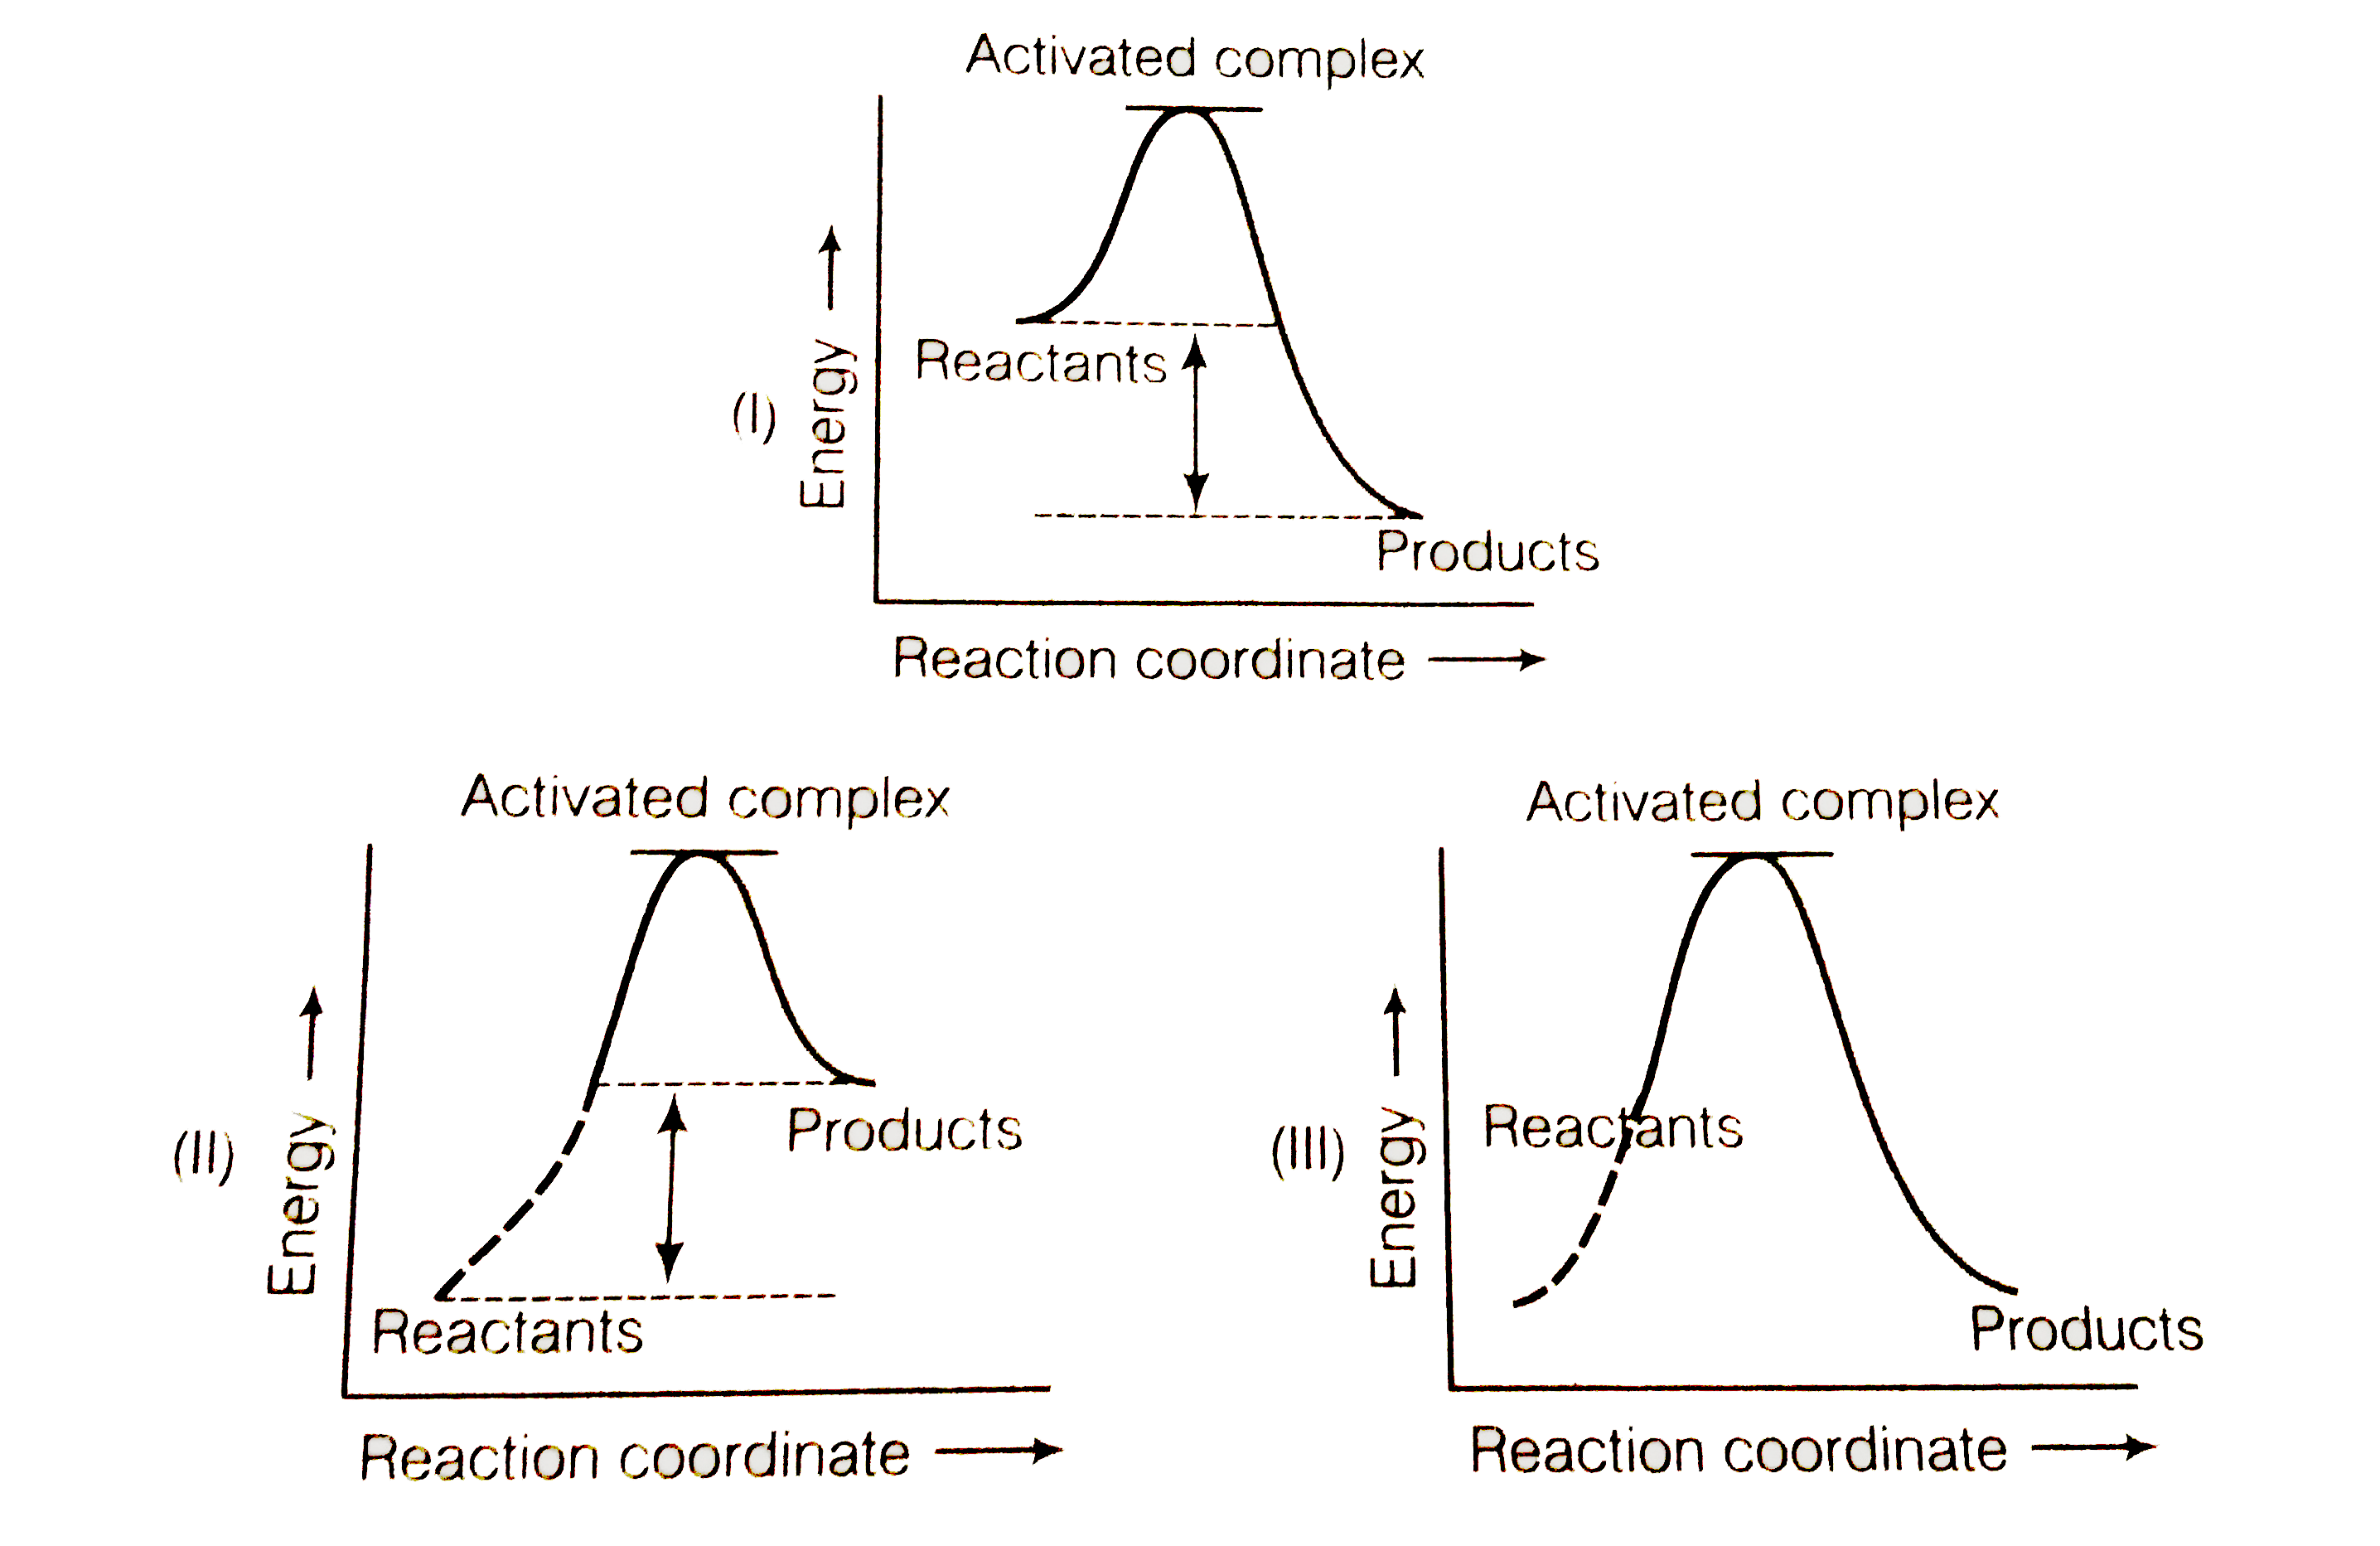
View SolutionWhich of the following graphs represents exothoermic reaction?

View SolutionWhich of the following graph represents uniform motion
View SolutionWhich of the following graph represents uniform motion
View SolutionWhich of the following graphs represents exothermic reaction ?

View Solution

