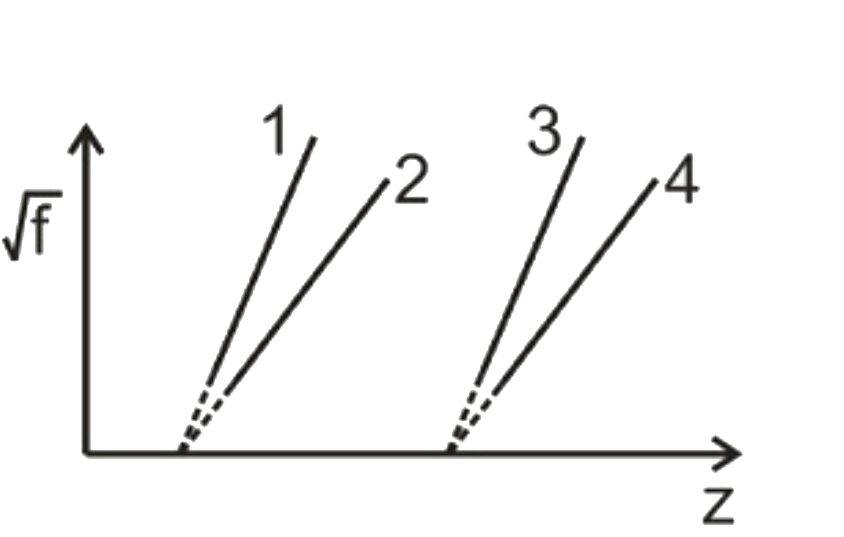
The graph given below, shows the variation of √f vs z for characteristics X- rays. Lines 1,2,3 and 4 shown in the graph corresponds to any one of Kα,Kβ,Lα,Lβ emission, then Lβ is represented by ( f = frequency, z = Atomic number)

Line 1
Line 2
Line 3
Line 4
The correct Answer is:C
Step by step video & image solution for The graph given below, shows the variation of sqrt(f) vs z for characteristics X- rays. Lines 1,2,3 and 4 shown in the graph corresponds to any one of K_(alpha) , K_(beta) , L_(alpha) , L_(beta) emission, then L_(beta) is represented by ( f = frequency, z = Atomic number) by Physics experts to help you in doubts & scoring excellent marks in Class 12 exams.
Updated on:21/07/2023Similar Questions
Obtain a relation between the frequencies of Kα,Kβ and Lα line for a target metrial .
View SolutionThe graph that correctly represents the relation of frequency v of a particular characteristic X - ray with the atomic number Z of the material is
View SolutionIf the frequency of Kα,Kβ and Lα , X-ray lines of a substance are vKα,vKβ, and vLβ
View SolutionIn X-rays spectrum, transition of an electron from an outer shell to an inner shell gives a characteristics X-rays spectral line. If we consider the spectrum line Kβ,LβnandMα , them
View SolutionIf λKα,λKβ and λLα are the wavelengths of Kα,Kβ and Lα lines, then
View Solution
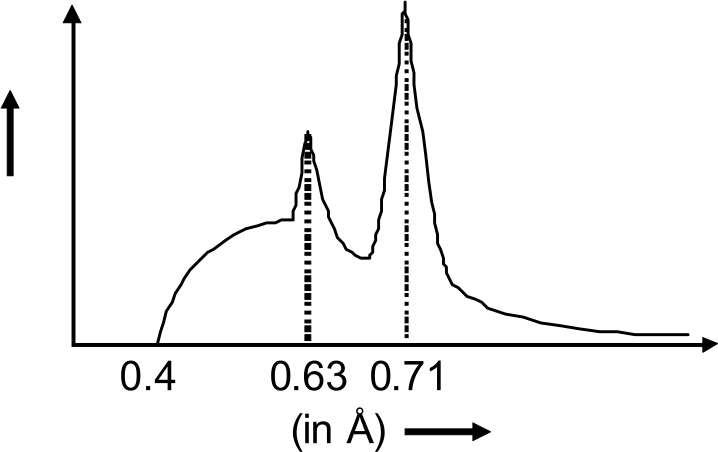
Figure shows intensity versus wavelength graph of X-rays coming from coolidge-tube with molybdenum as target element :
The two peaks shown in graph correspond to Kα and Kβ X-rays
Voltage applied across Coolidge tube is (approximately)
View SolutionDraw a labelled graph showing the variation of inductive reactance (XL) verses frequency (f)
View SolutionLet λα',λβ,andλ'α denote the wavelength of the X-ray of the Kα,Kβ,andLα lines in the characteristic X-rays for a metal. Then.
View SolutionLet λα,λβ,andλ'α denote the wavelength of the X-ray of the Kα,Kβ,andLα lines in the characteristic X-rays for a metal. Then.
View Solution
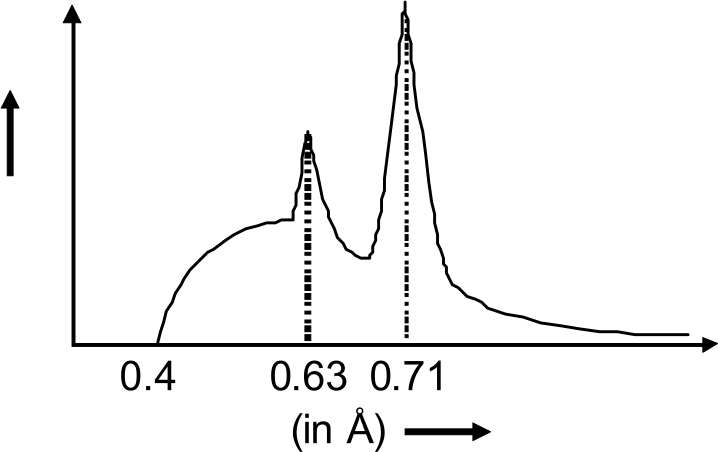
Figure shows intensity versus wavelength graph of X-rays coming from coolidge-tube with molybdenum as target element :
The two peaks shown in graph correspond to Kα and Kβ X-rays
Wavelength of Lα X-rays from Coolidge tube will be (approximately)
View Solution
