The correct graph representing the variation of total energy (Et), kinetic energy (Ek) and potential energy (U) of a satellite with its distance form the centre of earth is
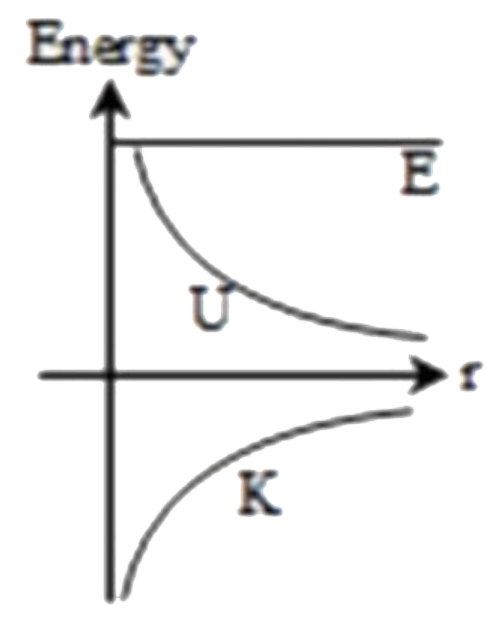
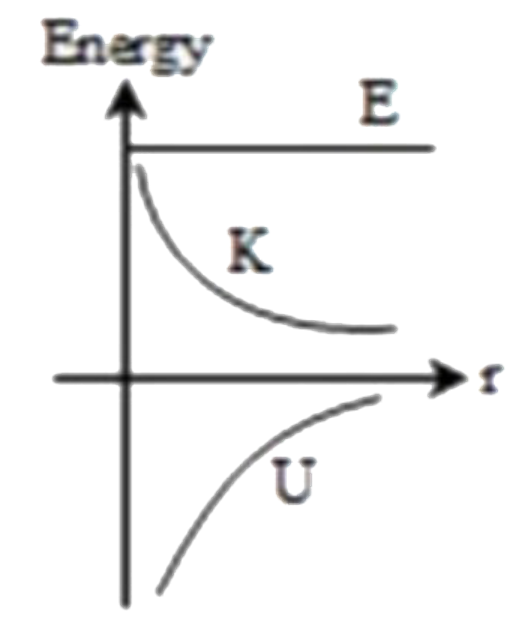
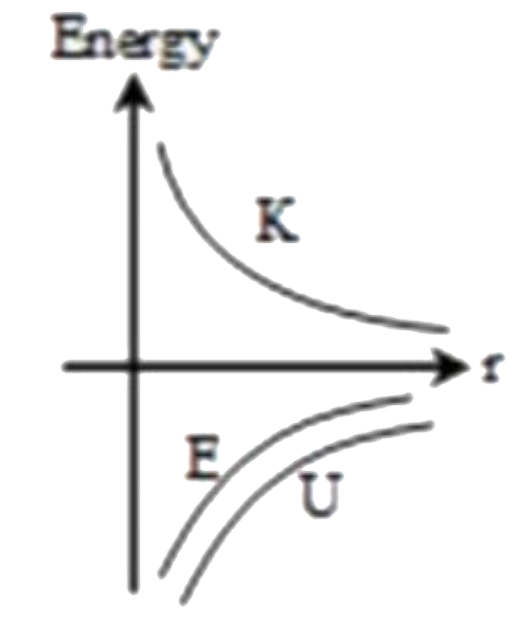
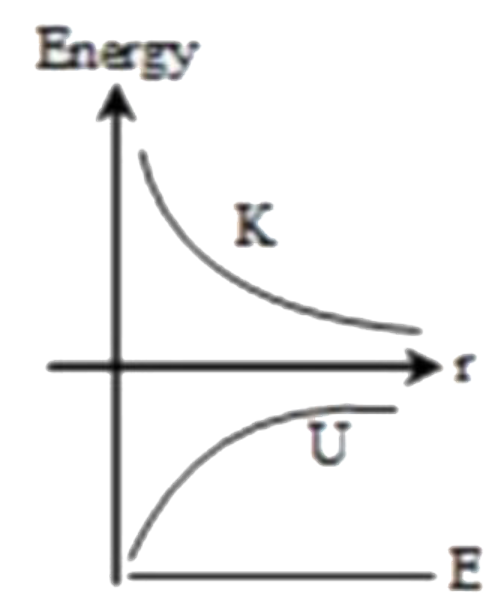
The correct Answer is:C
To solve the problem of determining the correct graph representing the variation of total energy Et, kinetic energy Ek, and potential energy U of a satellite with its distance from the center of the Earth, we can follow these steps:
Step 1: Understand the Energy Formulas
1. Total Energy (E): The total energy of a satellite in orbit is given by the formula:
E=−GMm2r
where G is the gravitational constant, M is the mass of the Earth, m is the mass of the satellite, and r is the distance from the center of the Earth.
2. Potential Energy (U): The gravitational potential energy is given by:
U=−GMmr
3. Kinetic Energy (K): The kinetic energy of the satellite can be expressed as:
K=GMm2r
Step 2: Analyze the Energy Behavior with Distance
- As the distance r increases (the satellite moves away from the Earth):
- Kinetic Energy (K): Since K is proportional to 1r, it decreases as r increases. However, it remains positive.
- Potential Energy (U): Since U is also proportional to −1r, it becomes less negative (increases) as r increases.
- Total Energy (E): The total energy is also negative and behaves similarly to potential energy, becoming less negative as r increases.
Step 3: Graphical Representation
- Kinetic Energy (K): The graph will start from a positive value and decrease towards zero as r increases.
- Potential Energy (U): The graph will start from a negative value and increase towards zero, but will always remain negative.
- Total Energy (E): The graph will also be negative, starting from a value less than that of potential energy and increasing towards zero, but will always remain below the potential energy graph.
Step 4: Identify the Correct Graph
Based on the behaviors outlined:
- The kinetic energy graph will be a decreasing curve starting from a positive value.
- The potential energy graph will be a decreasing curve starting from a negative value.
- The total energy graph will also be a decreasing curve, but it will lie above the total energy graph.
After analyzing the graphs provided in the options, we can conclude that Option C correctly represents the variation of total energy, kinetic energy, and potential energy of a satellite with its distance from the center of the Earth.
Summary of Steps
1. Write down the formulas for total energy, potential energy, and kinetic energy.
2. Analyze how each energy type varies with distance from the center of the Earth.
3. Draw the graphs based on the analysis.
4. Compare the drawn graphs with the options provided to identify the correct one.
1. Total Energy (E): The total energy of a satellite in orbit is given by the formula:
E=−GMm2r
where G is the gravitational constant, M is the mass of the Earth, m is the mass of the satellite, and r is the distance from the center of the Earth.
U=−GMmr
K=GMm2r
- As the distance r increases (the satellite moves away from the Earth):
- Kinetic Energy (K): Since K is proportional to 1r, it decreases as r increases. However, it remains positive.
- Potential Energy (U): Since U is also proportional to −1r, it becomes less negative (increases) as r increases.
- Total Energy (E): The total energy is also negative and behaves similarly to potential energy, becoming less negative as r increases.
- Kinetic Energy (K): The graph will start from a positive value and decrease towards zero as r increases.
- Potential Energy (U): The graph will start from a negative value and increase towards zero, but will always remain negative.
- Total Energy (E): The graph will also be negative, starting from a value less than that of potential energy and increasing towards zero, but will always remain below the potential energy graph.
Based on the behaviors outlined:
- The kinetic energy graph will be a decreasing curve starting from a positive value.
- The potential energy graph will be a decreasing curve starting from a negative value.
- The total energy graph will also be a decreasing curve, but it will lie above the total energy graph.
1. Write down the formulas for total energy, potential energy, and kinetic energy.
2. Analyze how each energy type varies with distance from the center of the Earth.
3. Draw the graphs based on the analysis.
4. Compare the drawn graphs with the options provided to identify the correct one.
Similar Questions
Sketch graph showing the variation of (i) the kinetic energy, (ii) the potential energy and (iii) the total energy of a simple harmonic oscillation with displacement.
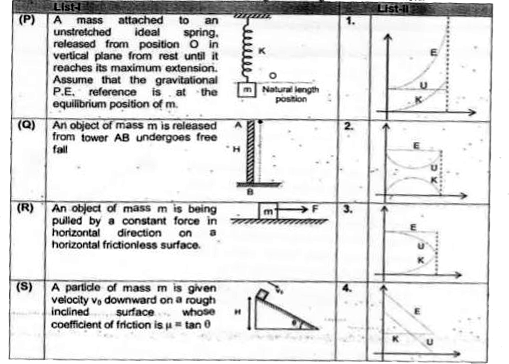
View SolutionThe physical situation in List-I with graphs of the variation of total energy (E), potential energy (U) and kinetic energy ( K) with time in List-II are given. Match the statements from List I with those in List II and select the correct answer using the code given below the lists.
View Solution
Knowledge Check
The relationship between kinetic energy (K) and potential energy (U) of electron moving in a orbit around the nucleus is
AU=−KBU=−2KCU=−3KDU=−12K
According to Bohr’s theory En= Total energy, Kn= Kinetic energy, Vn= Potential energy Rn= Radius of nth orbit:

View SolutionThe gravitational potential energy of a body at a distance r from the centre of earth is U. Its weight at a distance 2r from the centre of earth is
View SolutionIf the kinetic energy of a satellite orbiting around the earth is doubled then
View SolutionIf total energy of the same electron is E, then what would be its kinetic energy and potential energy .
View SolutionIf total energy of the same electron is E, then what would be its kinetic energy and potential energy .
View SolutionFor a satellite moving in an orbit around the earth, ratio of kinetic energy to potential energy is
View SolutionThe gravitational potential energy of a body at a distance r from the centre of earth is U. Its weight at a distance 2r from the centre of earth is
View Solution
