Consider two plots , where plot 'X' is having less species compared to plot 'Z', Select the true statement regarding X and Z .
Plot 'X' shows less year to year variation in total biomass
Plot 'Z' is less resistant to natural disturbance
Plot, 'X' has more productivity than plot 'X'
Plot 'Z' has more productivity then plot 'X'
The correct Answer is:D
To solve the question regarding the two plots, X and Z, we need to analyze the information given about the number of species in each plot and the implications of that on various ecological factors.
1. Understanding the Plots:
- Plot X has fewer species compared to Plot Z.
- This difference in species richness can influence various ecological characteristics such as productivity and resilience to disturbances.
2. Analyzing the Statements:
- Statement 1: "Plot X shows less year-to-year variation in total biomass."
- This statement is incorrect because the question does not provide any information about year-to-year variation in biomass. The relationship between species richness and biomass variation is not established in the question.
- Statement 2: "Plot Z is less resistant to natural disturbance."
- This statement is also incorrect. The question does not provide any information regarding the resistance of either plot to disturbances. Generally, more diverse ecosystems (like Plot Z) are more resilient to disturbances.
- Statement 3: "Plot X has more productivity than Plot Z."
- This statement is incorrect. Generally, plots with more species (like Plot Z) tend to have higher productivity due to greater resource utilization and niche differentiation.
- Statement 4: "Plot Z has more productivity than Plot X."
- This statement is correct. Since Plot Z has more species, it is likely to have higher productivity compared to Plot X, which has fewer species.
3. Conclusion:
- The true statement regarding the two plots is that "Plot Z has more productivity than Plot X."
Final Answer:
The correct statement is: Plot Z has more productivity than Plot X.
- Plot X has fewer species compared to Plot Z.
- This difference in species richness can influence various ecological characteristics such as productivity and resilience to disturbances.
- Statement 1: "Plot X shows less year-to-year variation in total biomass."
- This statement is incorrect because the question does not provide any information about year-to-year variation in biomass. The relationship between species richness and biomass variation is not established in the question.
- This statement is also incorrect. The question does not provide any information regarding the resistance of either plot to disturbances. Generally, more diverse ecosystems (like Plot Z) are more resilient to disturbances.
- This statement is incorrect. Generally, plots with more species (like Plot Z) tend to have higher productivity due to greater resource utilization and niche differentiation.
- This statement is correct. Since Plot Z has more species, it is likely to have higher productivity compared to Plot X, which has fewer species.
- The true statement regarding the two plots is that "Plot Z has more productivity than Plot X."
The correct statement is: Plot Z has more productivity than Plot X.
Similar Questions
Knowledge Check
Refer to the given figure and select the correct option regarding X,Y and Z.
 AXYZBrachioaurusArchaeopteryxTriceratopsBXYZArchaeopteryxTryannosaurusPteranodonCXYZArchaeopteryxStgosaurusTryrannosaurusDXYZArchaeopteryxBrachiosaurusTriceratops
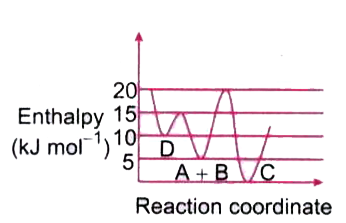
Consider the given plot of enthalpy of the following reaction between A and B. A+B→C+D. Identify the incorrect statement.
 AC is the thermodynamically stable product.BFormation of A and B from C has highest enthalpy of activation.CActivation enthalpy to form C is 5 kJ mor less than that to form D.DD is kinetically stable product.
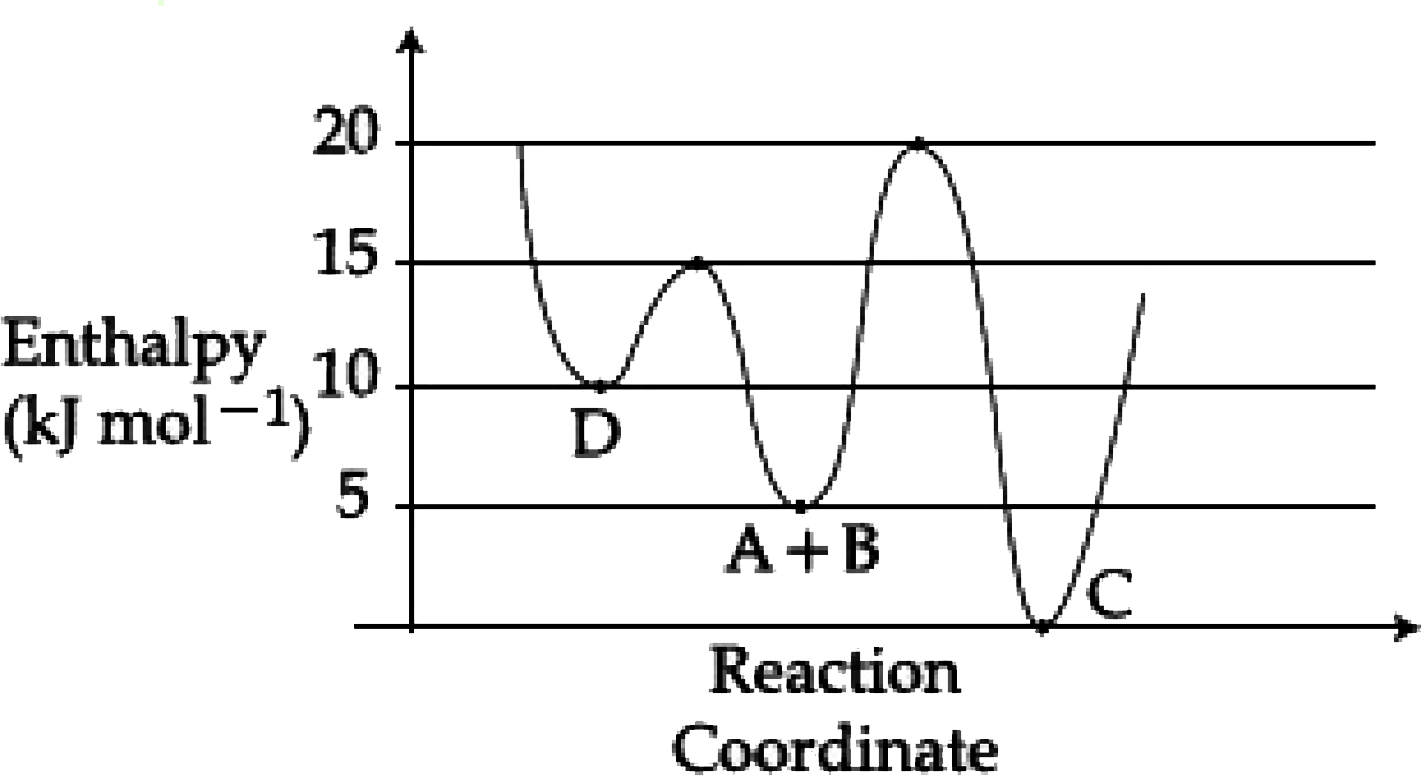
Consider the given plot of enthalpy of the following reaction between A and B. A+B→C+D. Identify the incorrect statements

View SolutionConsider the given plot of enthalpy of the following reaction between A and B. A+B→C+D. Identify the incorrect statements

View SolutionLet V and E represent the gravitational potential and field at a distance r from the centre of a uniform solid sphere. Consider the two statements.
A. the plot of V agasinst r is discotinuous
B. The plot of E against r is discontinuous.
View SolutionIf x gram of gas is adsobed by m gram of adsorbent at pressure P the plot of log xm versus log P is linear .the slope of the plot is :
(n and k are constant and n > 1)
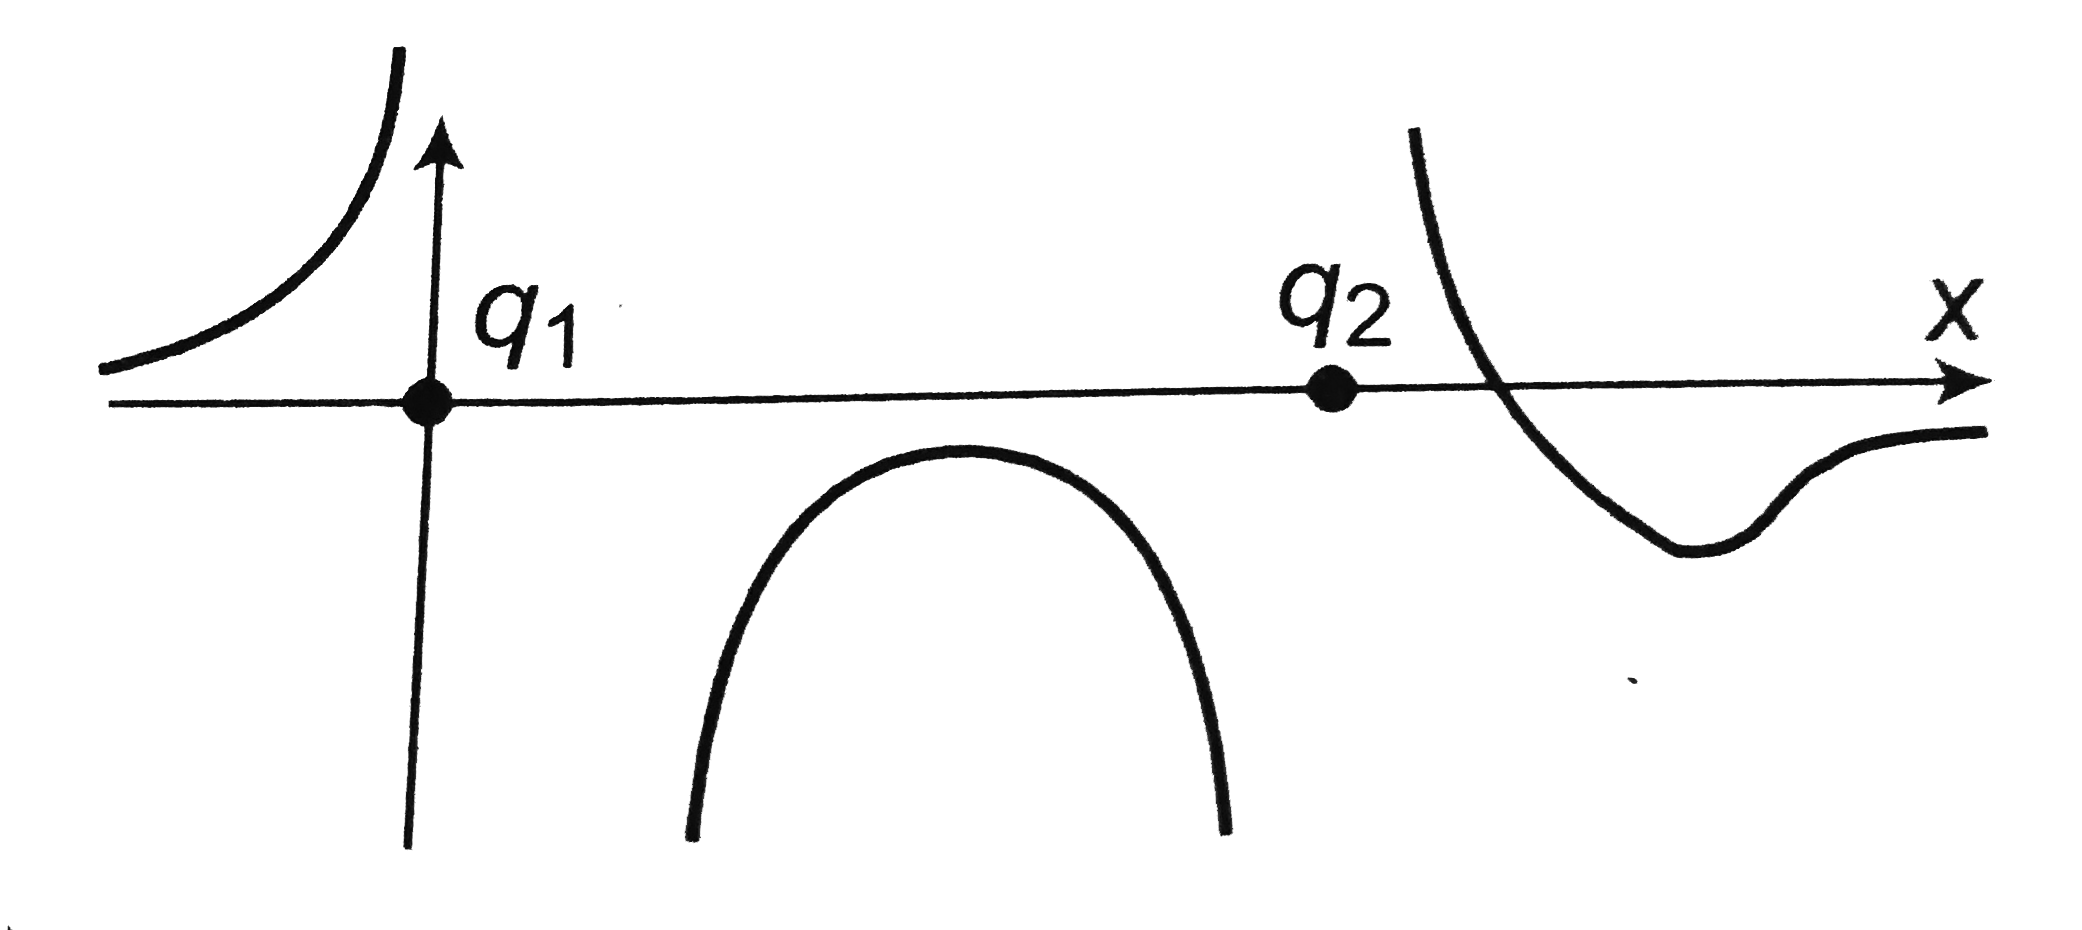
View SolutionTwo charges q1 and q2 are kept on x-axis and electric field at different points an x-axis is plotted against x. Choose correct statement about nature and magnitudes of q1 and q2

View SolutionFor a p-V plot, the slope of an adiabatic curve = x × slope of isothermal at the same point. Here x is :
View Solution
