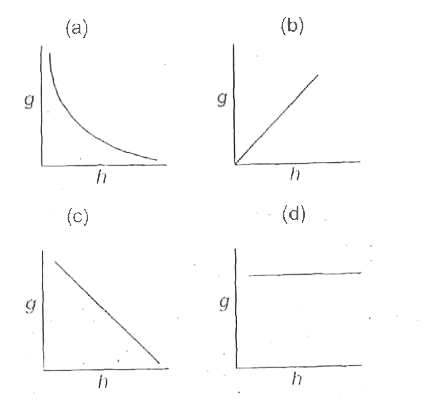
Which graph correctley presents the variation of acceleration due to gravity with the distance form the centre of the earth?
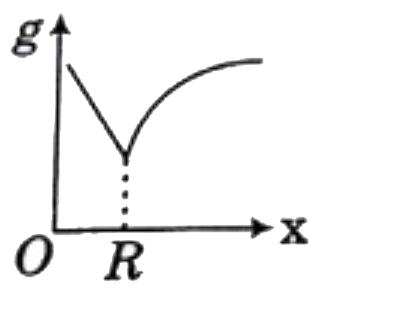
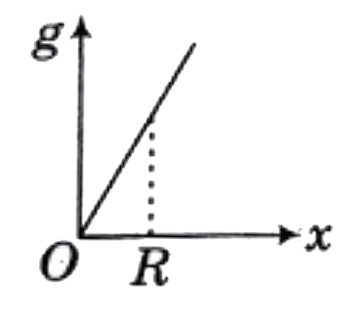
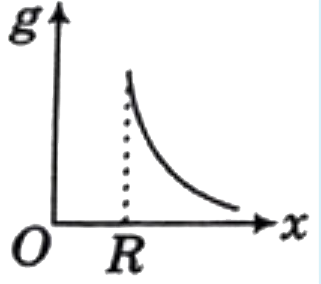
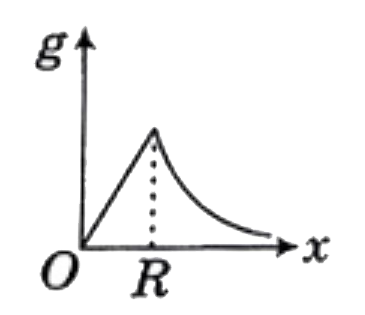
The correct Answer is:D
To determine the correct graph that represents the variation of acceleration due to gravity (g) with the distance from the center of the Earth (r), we can analyze the behavior of g in two distinct regions: outside the Earth and inside the Earth.
1. Understanding the Concept:
- The acceleration due to gravity (g) varies with distance from the center of the Earth. We need to analyze how g changes as we move from the center of the Earth to the surface and then beyond the surface.
2. Case 1: Outside the Earth (r > R, where R is the radius of the Earth):
- The formula for gravitational acceleration outside the Earth is given by:
g=GMer2
where G is the gravitational constant and Me is the mass of the Earth.
- As the distance (r) increases, g decreases with the square of the distance, indicating that g is inversely proportional to r2.
3. Case 2: Inside the Earth (r < R):
- The formula for gravitational acceleration inside the Earth is:
g=GMeR3r
Here, g is directly proportional to the distance (r) from the center of the Earth.
- This means that as we move from the center of the Earth towards the surface, g increases linearly with r.
4. Graphical Representation:
- At the center of the Earth (r = 0), g = 0.
- As we move towards the surface, g increases linearly until it reaches its maximum value at the surface (r = R).
- Beyond the surface, g decreases following an inverse square law.
5. Identifying the Correct Graph:
- The graph should start from zero at the center, increase linearly to a maximum at the surface, and then decrease following a curve that represents the inverse square relationship as we move further away from the Earth.
6. Conclusion:
- After analyzing the options provided, the correct graph that represents this variation is the one that shows a linear increase from 0 to maximum at the surface and then a decrease following the inverse square law.
Final Answer:
The fourth option is the correct graph representing the variation of acceleration due to gravity with the distance from the center of the Earth.
- The acceleration due to gravity (g) varies with distance from the center of the Earth. We need to analyze how g changes as we move from the center of the Earth to the surface and then beyond the surface.
- The formula for gravitational acceleration outside the Earth is given by:
g=GMer2
where G is the gravitational constant and Me is the mass of the Earth.
- As the distance (r) increases, g decreases with the square of the distance, indicating that g is inversely proportional to r2.
- The formula for gravitational acceleration inside the Earth is:
g=GMeR3r
Here, g is directly proportional to the distance (r) from the center of the Earth.
- This means that as we move from the center of the Earth towards the surface, g increases linearly with r.
- At the center of the Earth (r = 0), g = 0.
- As we move towards the surface, g increases linearly until it reaches its maximum value at the surface (r = R).
- Beyond the surface, g decreases following an inverse square law.
- The graph should start from zero at the center, increase linearly to a maximum at the surface, and then decrease following a curve that represents the inverse square relationship as we move further away from the Earth.
- After analyzing the options provided, the correct graph that represents this variation is the one that shows a linear increase from 0 to maximum at the surface and then a decrease following the inverse square law.
The fourth option is the correct graph representing the variation of acceleration due to gravity with the distance from the center of the Earth.
Similar Questions
Knowledge Check
The acceleration due to gravity on the moon is
A(16)th that of the earthBsame that of the earthC(13)rd that of the earthD(15)th that of the earthAcceleration due to gravity at any point inside the earth
Avaries inversely as the square of the distance from the centreBis independent of the distance from the centreCis directly proportional to the distance from the centreDis inversely proportional to the distance from centre
Acceleration due to gravity is minimum at
View SolutionAcceleration due to gravity is maximum at
View SolutionWhich of the following graphs shows the variation of acceleration due to gravity g with depth h from the surface of the earth ?
View SolutionThe acceleration due to gravity at a depth R/2 below the surface of the earth is
View SolutionA satellite of mass m is moving in a circular or orbit of radius R around the earth. The radius of the earth is r and the acceleration due to gravity at the surface of the earth is g. Obtain expressions for the following :
(a) The acceleration due to gravity at a distance R from the centre of the earth
(b) The linear speed of the satellite
(c ) The time period of the satellite
View SolutionWhich of the following graphs best represents the variation of acceleration 'a' with displacement x?
View Solution
