The product (PV) is plotted against P at two temperature and the result is given in following figure
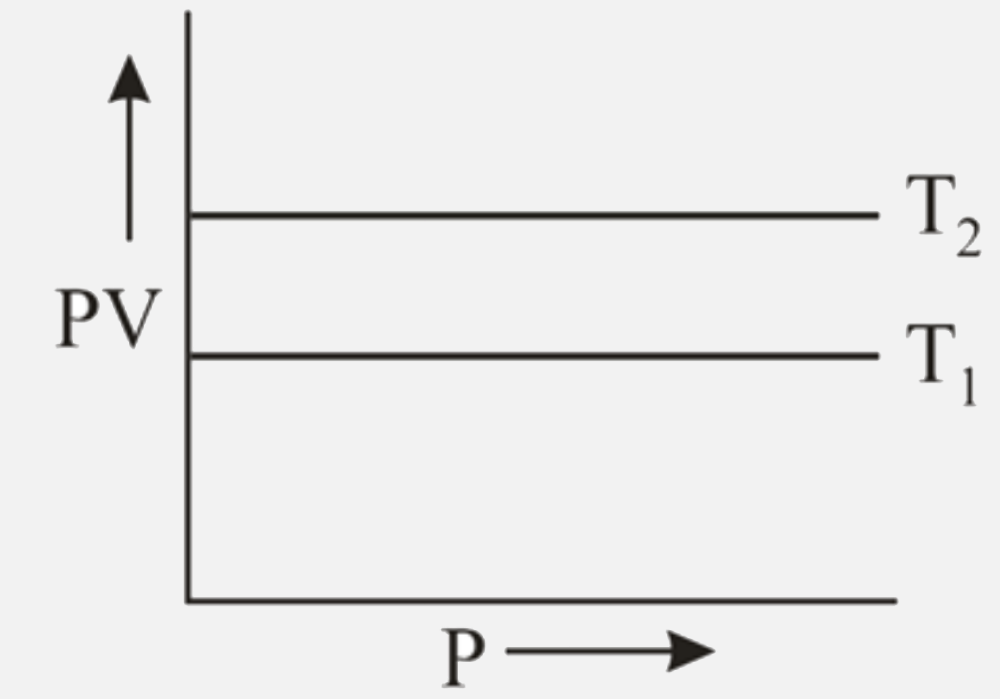
What is correct about ?
The correct Answer is:B
Step by step video & image solution for The product (PV) is plotted against P at two temperature T_1 and T_2 and the result is given in following figure What is correct about T_1 and T_2 ? by Chemistry experts to help you in doubts & scoring excellent marks in Class 12 exams.
Updated on:21/07/2023Similar Questions
Knowledge Check
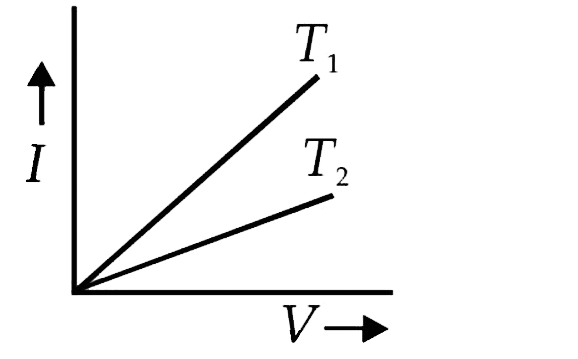
Assertion : Current versus potential difference (i-V) graph for a conductor at two different temperatures T1 and T2 is shown in figure. Hence T1>T2.
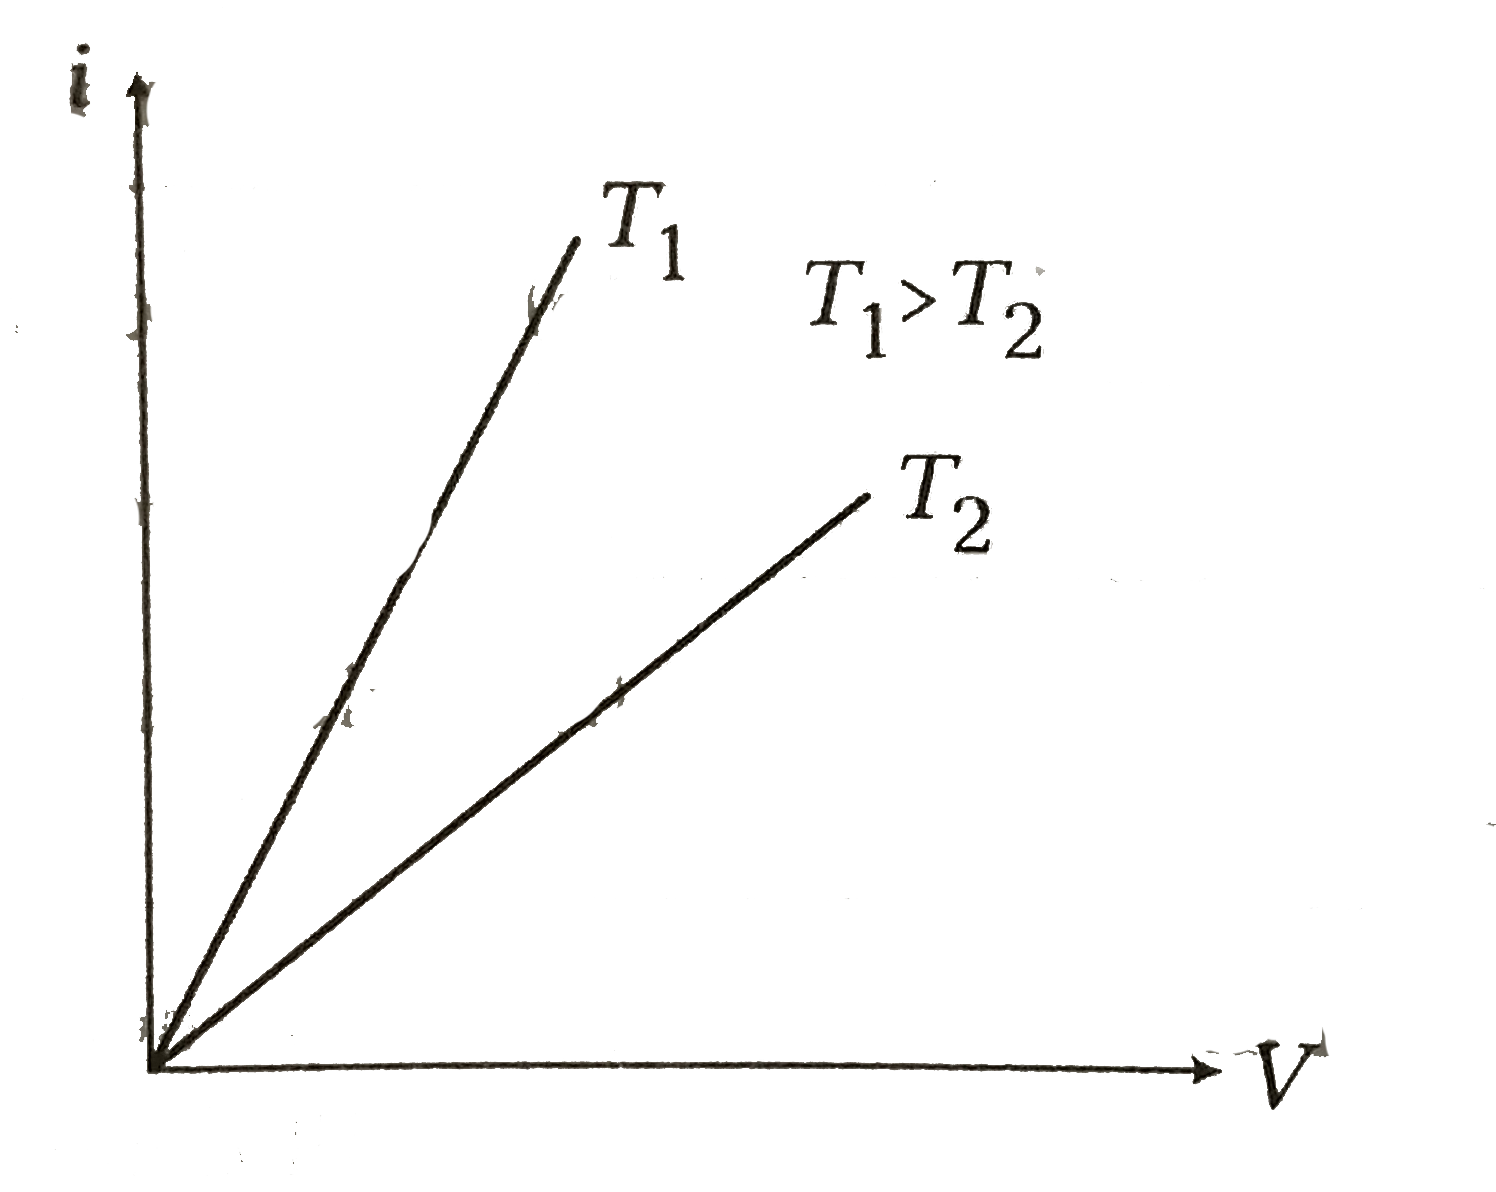
Reason : Resistance of a conductor increases with rise in temperature.Acos2θBsin2θCcot2θDtan2θThe voltage V and current I v graphs for a conductor at two different temperatures T1andT2 are shown in the figure. The relation between T1andT2 is
 AT1>T2BT1<T2CT1=T2DT1=1T2
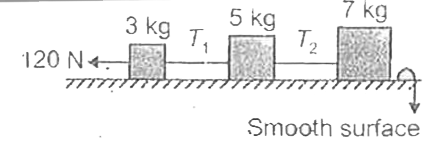
Find T1andT2 in the given figure.
View SolutionRate of reaction (r ) is plotted against temperature (T) for an enzyme catalysed reaction. Which of the following is correct representation ?
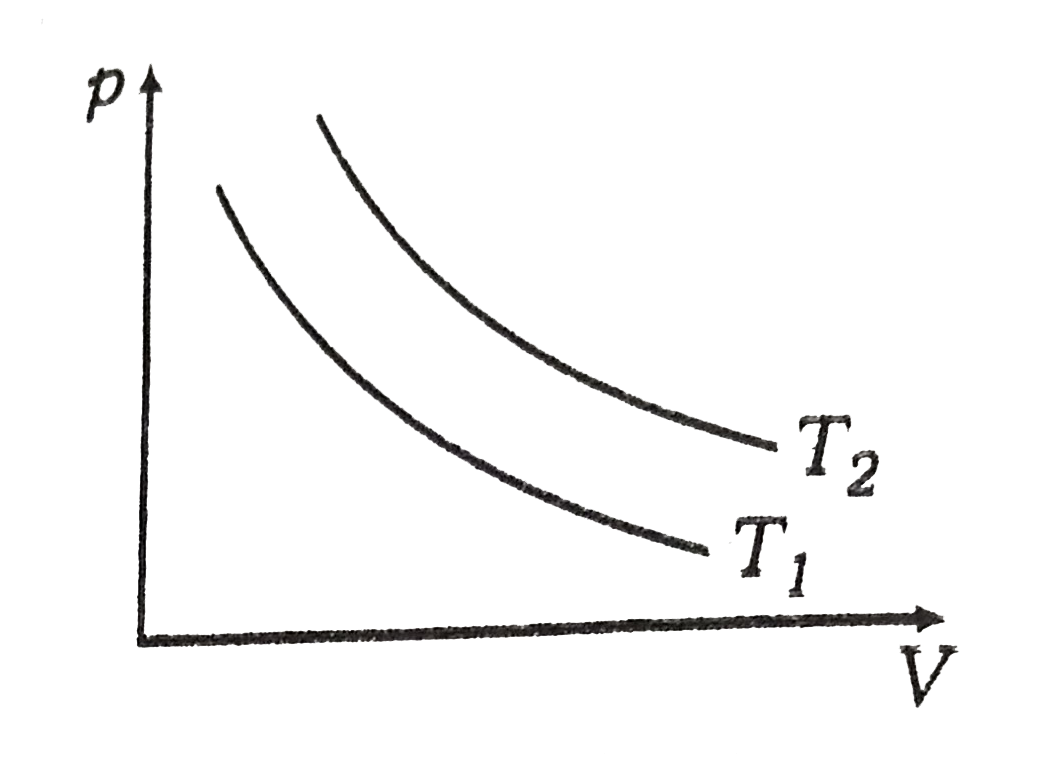
View SolutionThe adjoining fgure shows graph of pressure and volume of a gas at two temperatures T1 and T2 Which one the following is correct
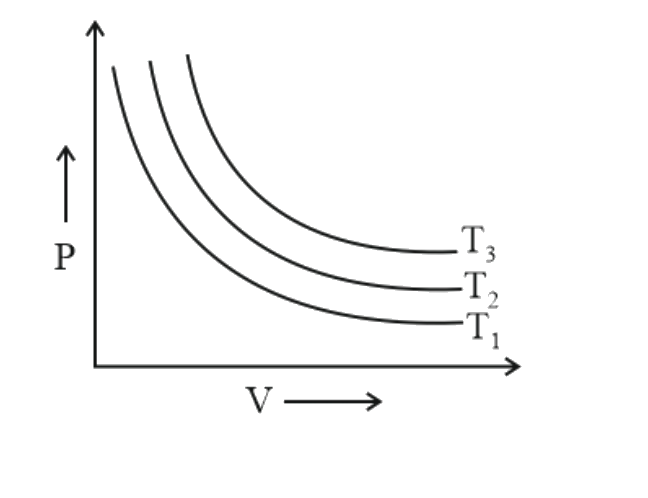
View Solutionfor the given PV isotherms , which of the following is correct for T1,T2,T3 ?
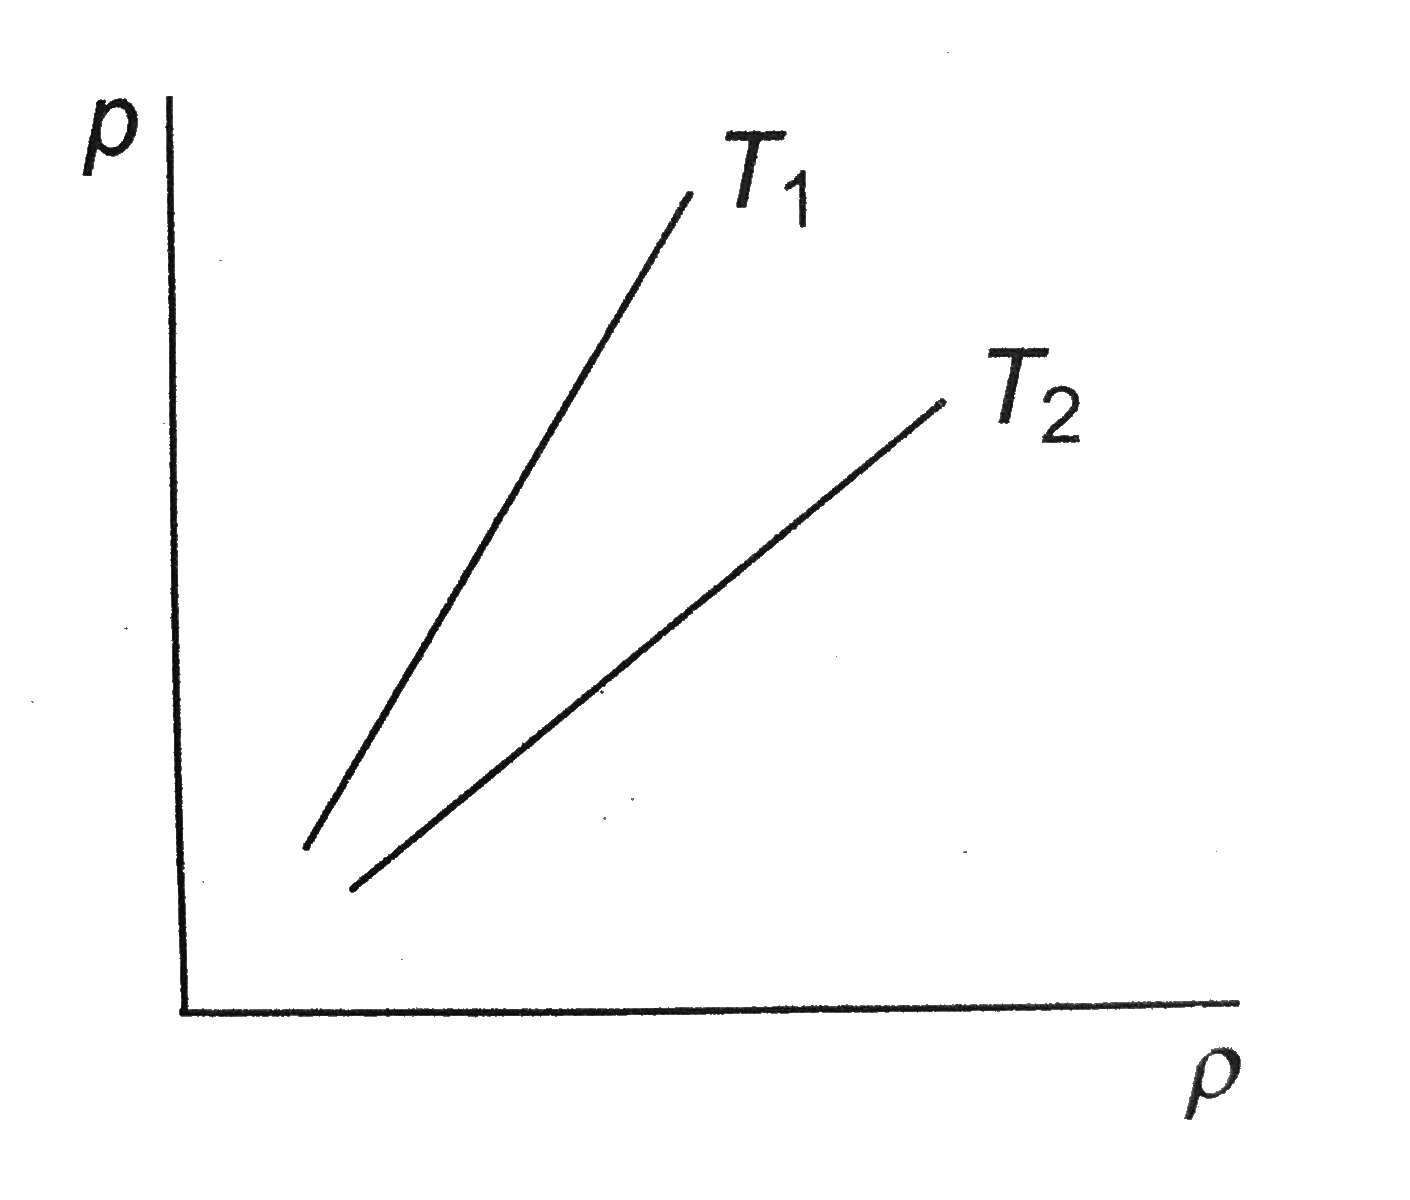
View SolutionFigure shows graphs of pressure vs density for an ideal gas at two temperature T1andT2. Which of the following is correct?
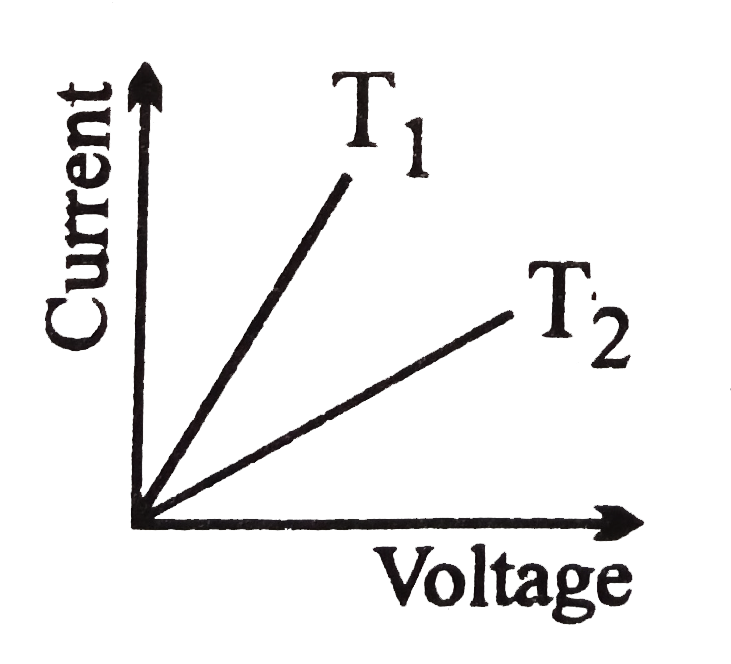
View SolutionThe current - voltage graphs for a given metallic wire at two different temperatures T1andT2 are shown in the figure.
The temperature T2 is greater than T1.
View Solution

