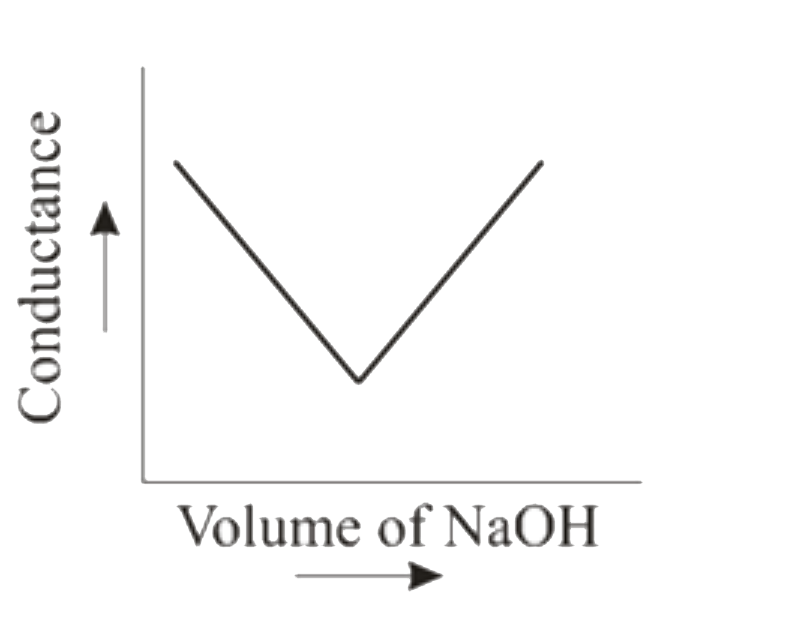
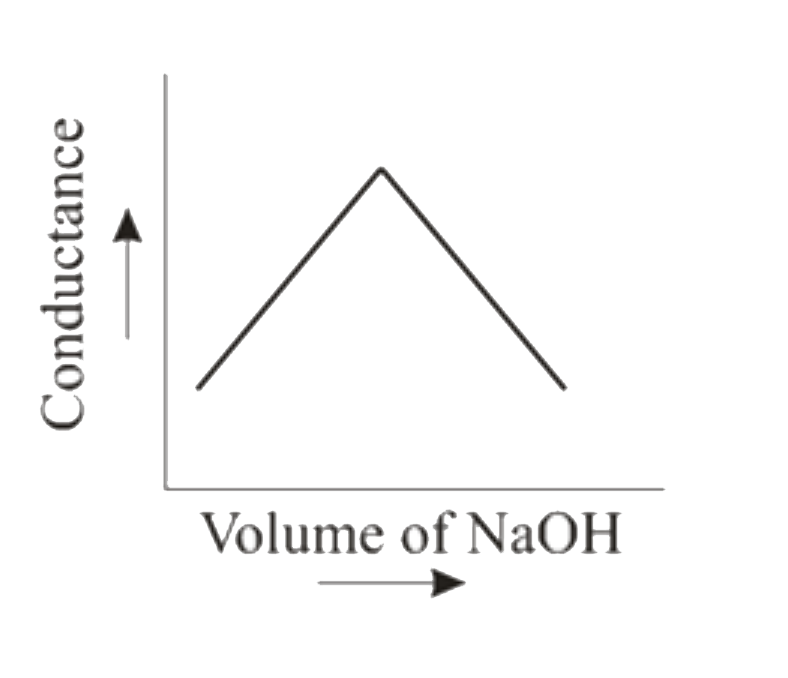
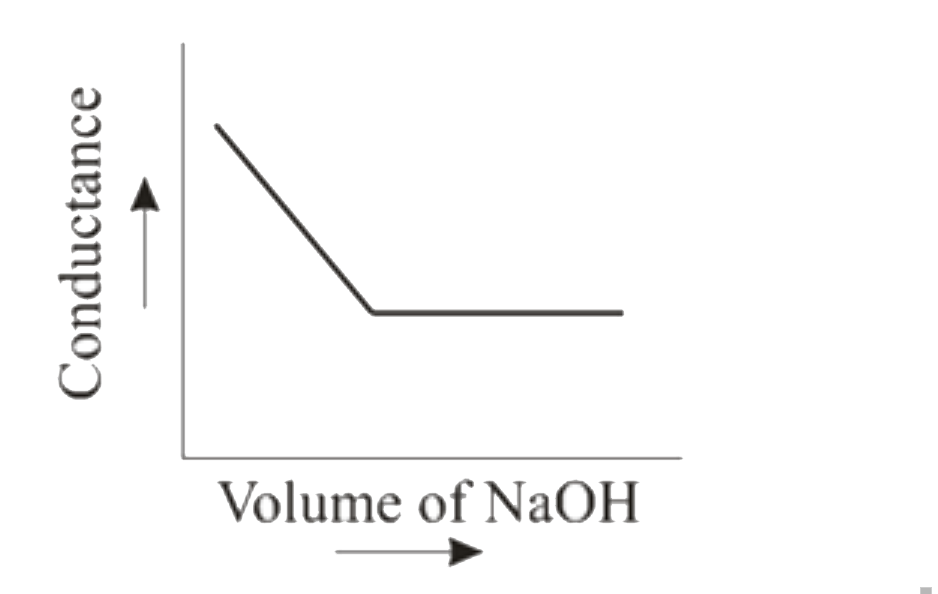
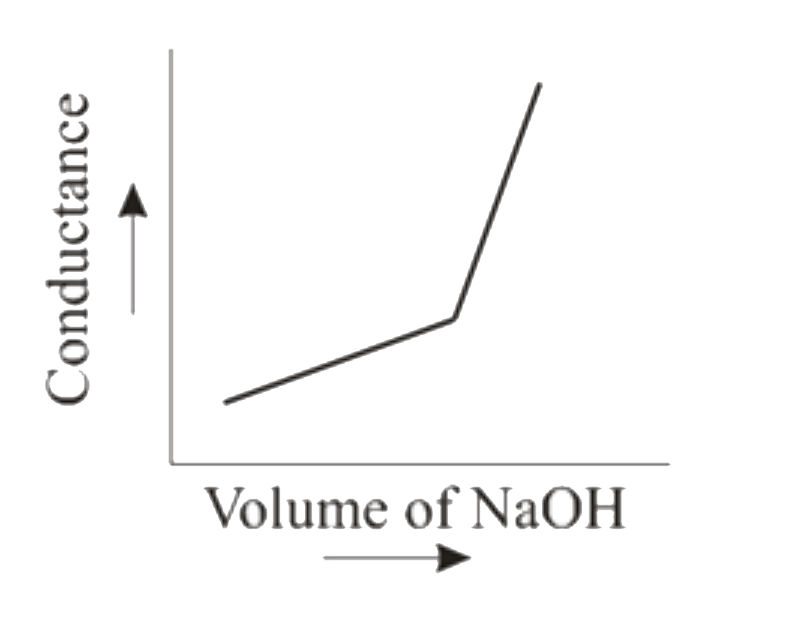
When HCl (aq) is titrated with NaOH(aq) conductometrically then the graphical representation of the titration will be
The correct Answer is:A
To solve the problem of how the conductance changes when HCl (aq) is titrated with NaOH (aq), we can break down the process step by step.
1. Understanding the Initial Situation:
- In the beginning, we have a solution of HCl, which dissociates into H⁺ and Cl⁻ ions. The presence of H⁺ ions contributes significantly to the conductivity of the solution because they are highly mobile and carry charge effectively.
Hint: Remember that strong acids like HCl dissociate completely in solution, contributing to high conductivity.
2. Adding NaOH:
- As NaOH is added to the HCl solution, it dissociates into Na⁺ and OH⁻ ions. The H⁺ ions from HCl will react with OH⁻ ions from NaOH to form water (H₂O). This neutralization reaction reduces the concentration of H⁺ ions in the solution.
Hint: Focus on the neutralization reaction: H⁺ + OH⁻ → H₂O, which decreases the number of H⁺ ions.
3. Conductivity Changes:
- Initially, as NaOH is added, the concentration of H⁺ ions decreases, leading to a decrease in conductivity. This is because the H⁺ ions, which have high mobility, are being neutralized.
Hint: Conductivity is directly related to the concentration of mobile ions in solution. A decrease in H⁺ means lower conductivity.
4. Reaching the Equivalence Point:
- At the equivalence point, all H⁺ ions have reacted with OH⁻ ions. The solution now contains Na⁺ and Cl⁻ ions, and the conductivity is at its lowest point.
Hint: The equivalence point is where the amount of titrant (NaOH) added is stoichiometrically equivalent to the amount of analyte (HCl).
5. Post-Equivalence Point:
- After the equivalence point, if more NaOH is added, the concentration of OH⁻ ions increases. Since OH⁻ ions also contribute to conductivity, the overall conductivity of the solution starts to increase again.
Hint: After neutralization, the increase in OH⁻ ions will lead to an increase in conductivity.
6. Graphical Representation:
- When plotting conductivity against the volume of NaOH added, the graph will show a decrease in conductivity as H⁺ ions are neutralized, reaching a minimum at the equivalence point, followed by an increase in conductivity as more OH⁻ ions are added.
Hint: The graph will have a characteristic 'V' shape: decreasing to a minimum at the equivalence point and then increasing.
Conclusion:
The correct graphical representation of the titration of HCl with NaOH conductometrically will show a decrease in conductivity until the equivalence point, followed by an increase in conductivity after the equivalence point.
Final Answer:
The graphical representation of the titration of HCl (aq) with NaOH (aq) conductometrically will show a decrease in conductivity until the equivalence point, followed by an increase in conductivity after the equivalence point.
- In the beginning, we have a solution of HCl, which dissociates into H⁺ and Cl⁻ ions. The presence of H⁺ ions contributes significantly to the conductivity of the solution because they are highly mobile and carry charge effectively.
- As NaOH is added to the HCl solution, it dissociates into Na⁺ and OH⁻ ions. The H⁺ ions from HCl will react with OH⁻ ions from NaOH to form water (H₂O). This neutralization reaction reduces the concentration of H⁺ ions in the solution.
- Initially, as NaOH is added, the concentration of H⁺ ions decreases, leading to a decrease in conductivity. This is because the H⁺ ions, which have high mobility, are being neutralized.
- At the equivalence point, all H⁺ ions have reacted with OH⁻ ions. The solution now contains Na⁺ and Cl⁻ ions, and the conductivity is at its lowest point.
- After the equivalence point, if more NaOH is added, the concentration of OH⁻ ions increases. Since OH⁻ ions also contribute to conductivity, the overall conductivity of the solution starts to increase again.
- When plotting conductivity against the volume of NaOH added, the graph will show a decrease in conductivity as H⁺ ions are neutralized, reaching a minimum at the equivalence point, followed by an increase in conductivity as more OH⁻ ions are added.
The correct graphical representation of the titration of HCl with NaOH conductometrically will show a decrease in conductivity until the equivalence point, followed by an increase in conductivity after the equivalence point.
The graphical representation of the titration of HCl (aq) with NaOH (aq) conductometrically will show a decrease in conductivity until the equivalence point, followed by an increase in conductivity after the equivalence point.
Similar Questions
HNO3(aq) is titrated with NaOH(aq) condutomatrically, graphical representation of the titration is :
a.
b.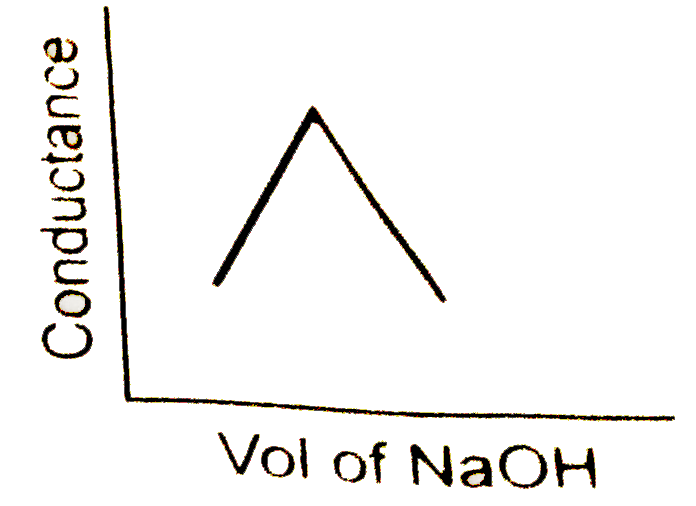
c.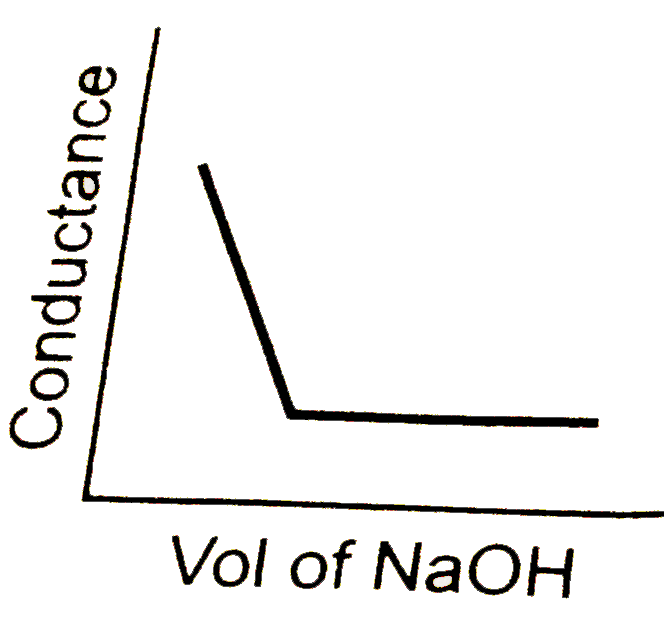
d.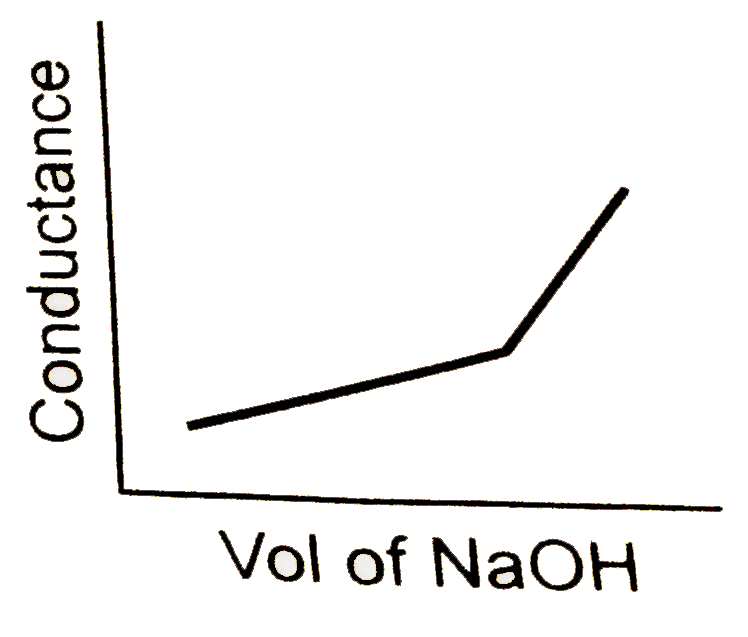
View SolutionAcetic acid is titrated with NaOH solution. Which of the following statement is correct for this titration?
View SolutionWhen CH3COOCH3+HCl is titrated with NaOH then at neutral point the colour of phenopthalein becomes colourless from pink due to:
View SolutionMono sodium salt of oxalic acid is titrated with NaOH Solution : In the second titration it is titrated with KMnO4 Solution : The ratio of equivalnet of monosodium oxalate with NaOH and KMnO4 is
View SolutionCH3COOH is titrated with NaOH solution. Which of the following statements is true ?
View SolutionA weak acid (HA) is titrated with N/100NaOH. What will be the pH when 50% of titration is completed. Given Ka=1−4 & concentration of HA=0.1M
View SolutionIn 0.1M HCl solution, 0.1M NaOH solution is added gradually then identify the correct graph in this titration
View SolutionStatement-1:Phenolphathalein can be used as indicator in the titration of weak acid with NaOH.
Statement-2 :Near the end point in the titration of weak acid with NaOH, the pH of the solutions is alkaline due to hydrolysis of anion.
View SolutionpH of 0.1 N NaOH(aq) solution
View SolutionThe electricity conductivity of a solution serves as a means of determing the end point in a chemical reaction, involved in the titration of acids, bases, or precipitation. Which of the following conductometric titrations represent the curve of HClvsNaOH
x− axis ⇒ Volume of alkali added
y− axis⇒ Conductivity
(a)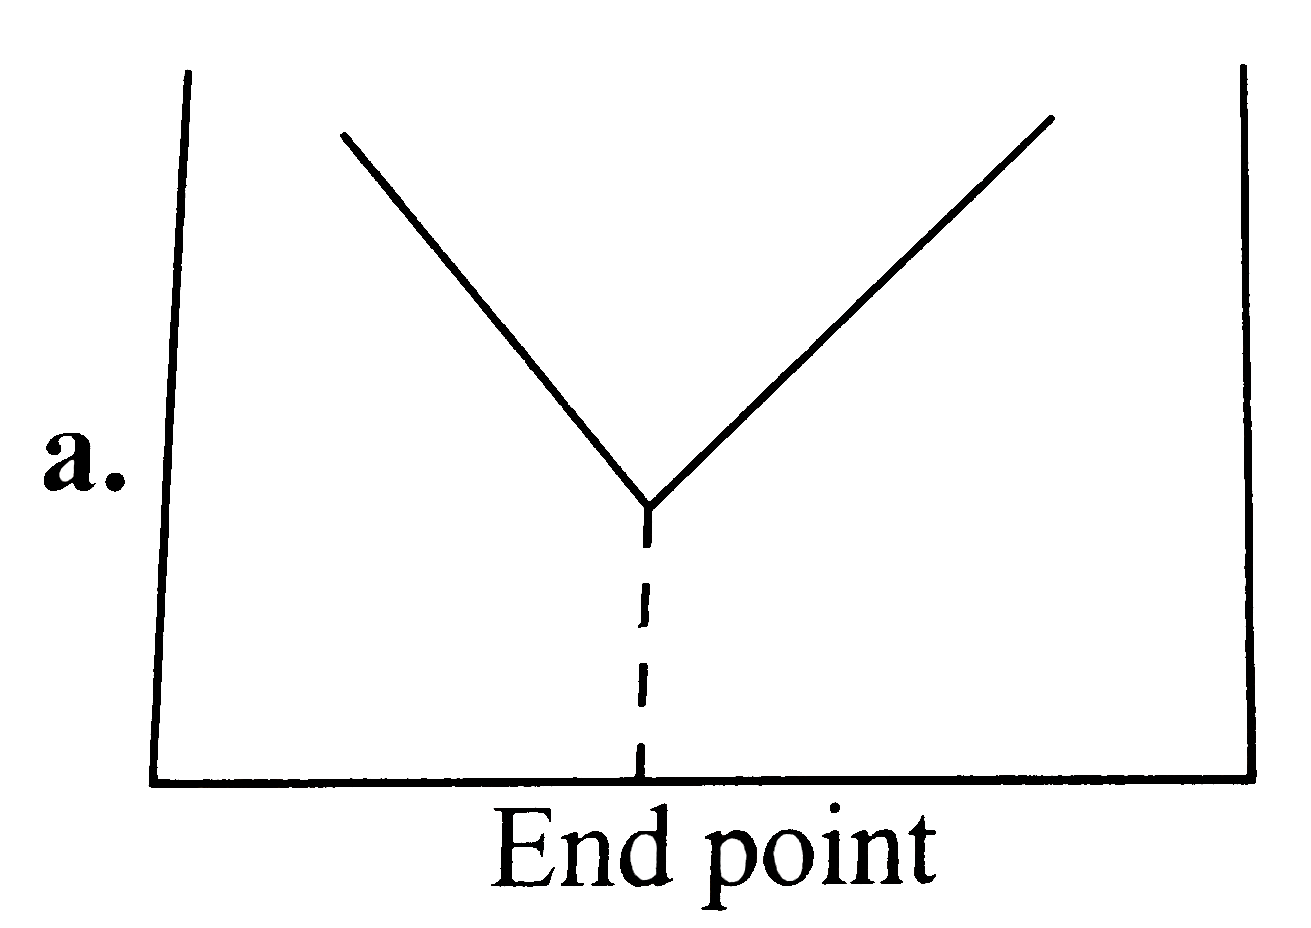
(b)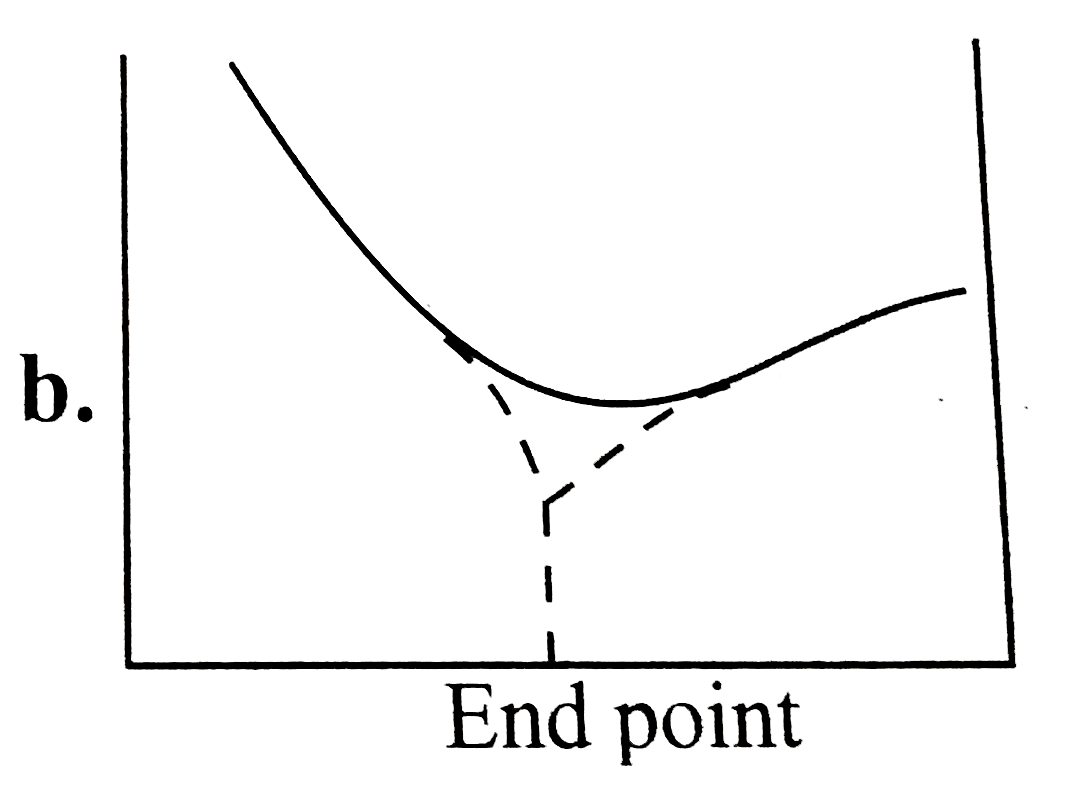
(c)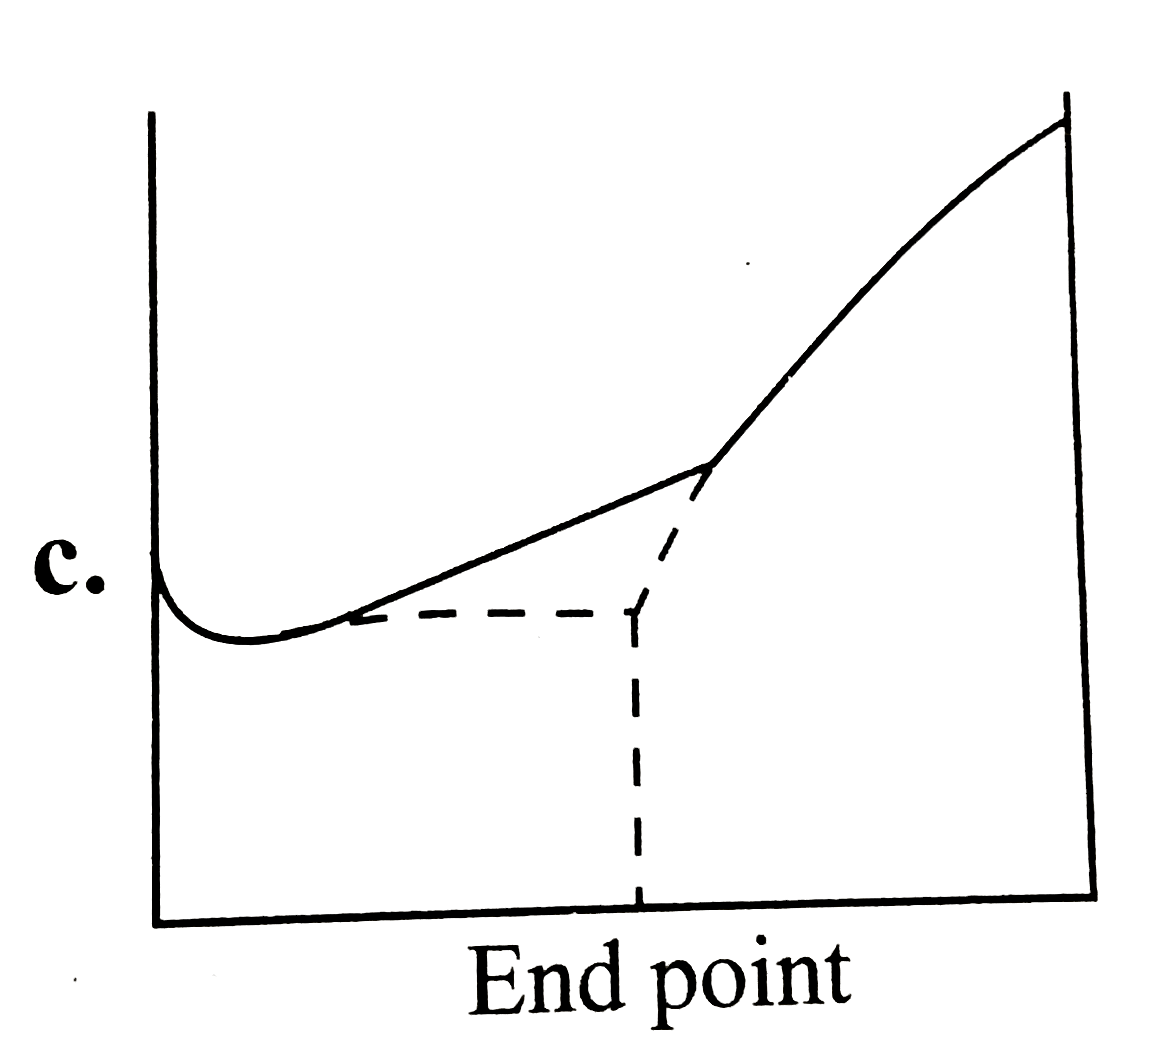
(d)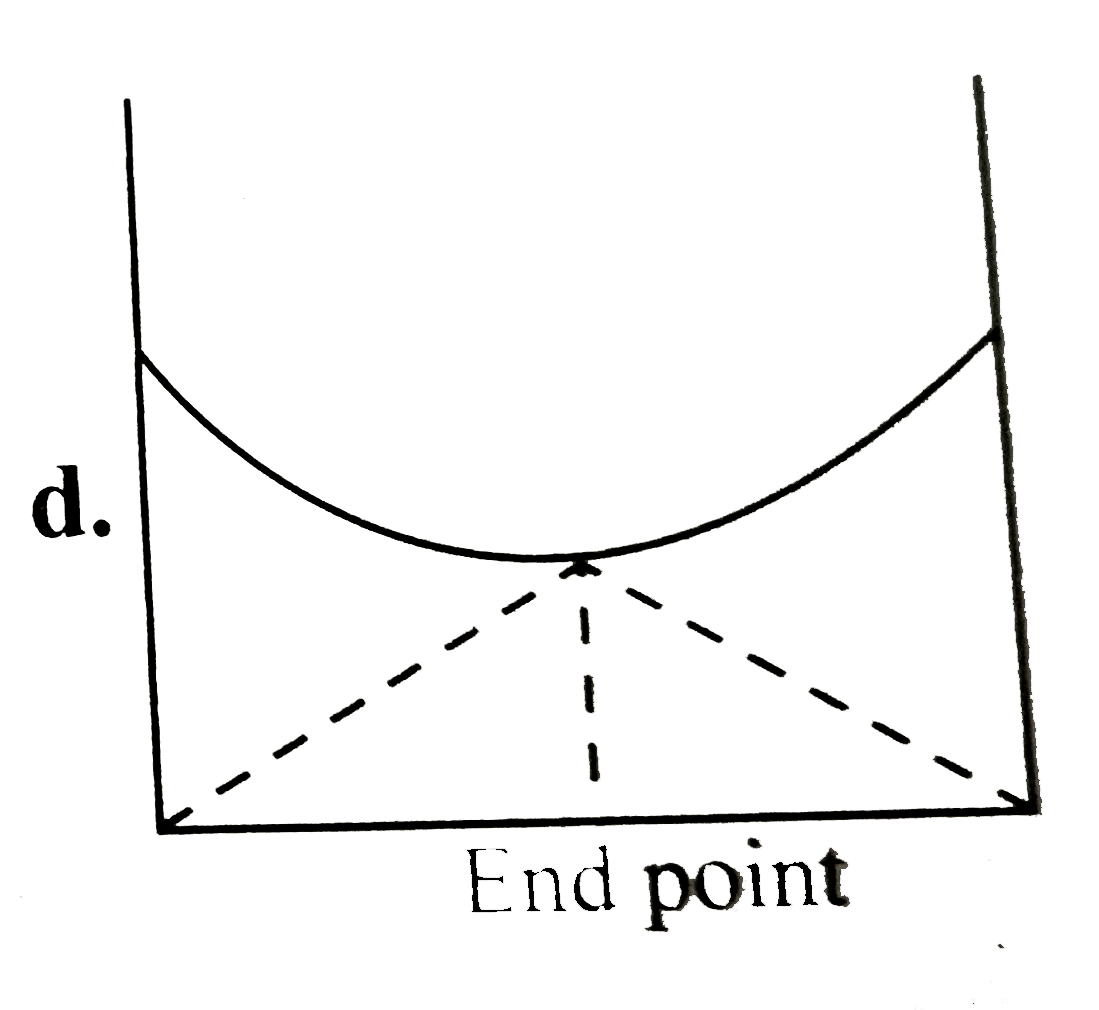
View Solution
