Which one of the following curves represents the graph pH during the titration of NaOH and HCl(aq)
A

B

C

D

Text Solution
The correct Answer is:A
|
Topper's Solved these Questions
- IONIC EQUILIBRIUMBOOK - NARAYNACHAPTER - IONIC EQUILIBRIUMEXERCISE - Level-VI (H.W)
35 Videos
- IONIC EQUILIBRIUMBOOK - NARAYNACHAPTER - IONIC EQUILIBRIUMEXERCISE - Level-II (H.W)
51 Videos
- HYDROGEN & ITS COMPOUNDSBOOK - NARAYNACHAPTER - HYDROGEN & ITS COMPOUNDSEXERCISE - LEVEL-4
21 Videos
- PERIODIC TABLE BOOK - NARAYNACHAPTER - PERIODIC TABLE EXERCISE - All Questions
568 Videos
Similar Questions
Knowledge Check
which one of the following curves represents the graph of pH during titration of NaOH and HCl (aq).?
A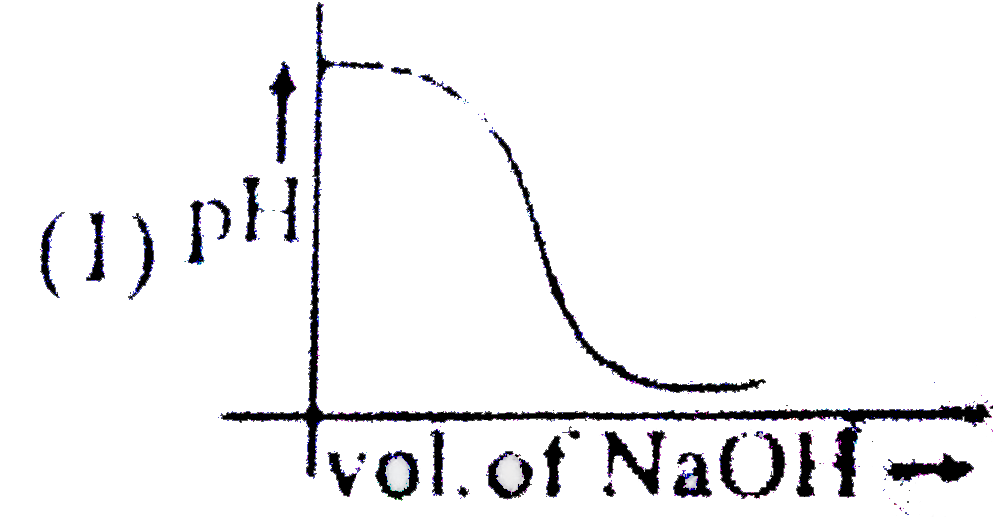 B
B C
C D
D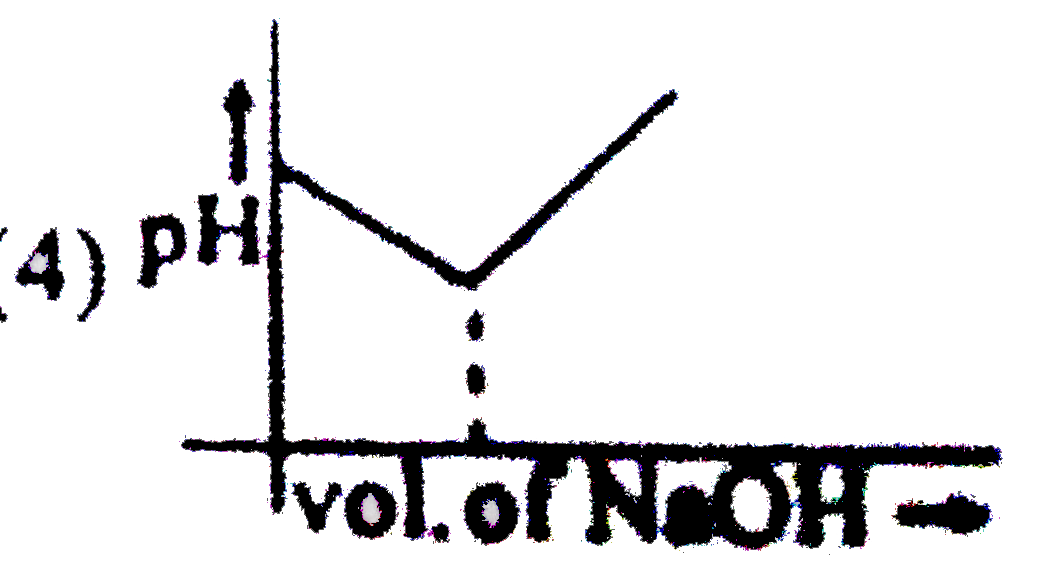
Which one of the following graphs represents motion?
A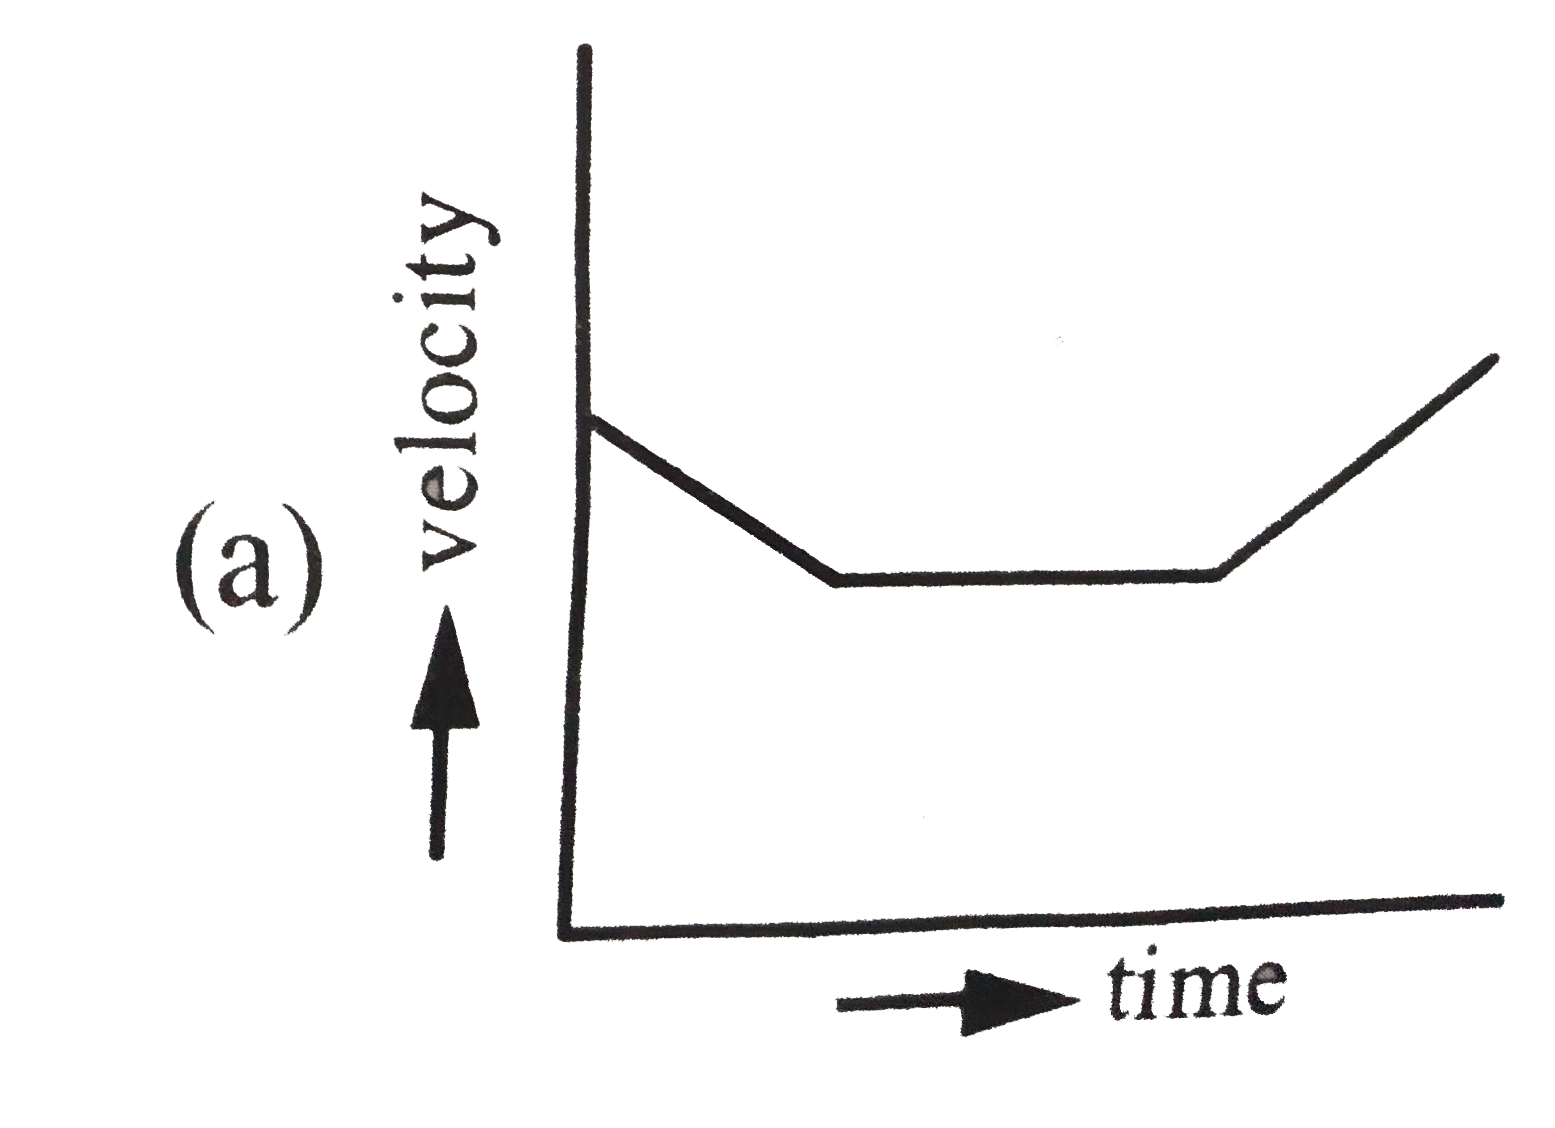 B
B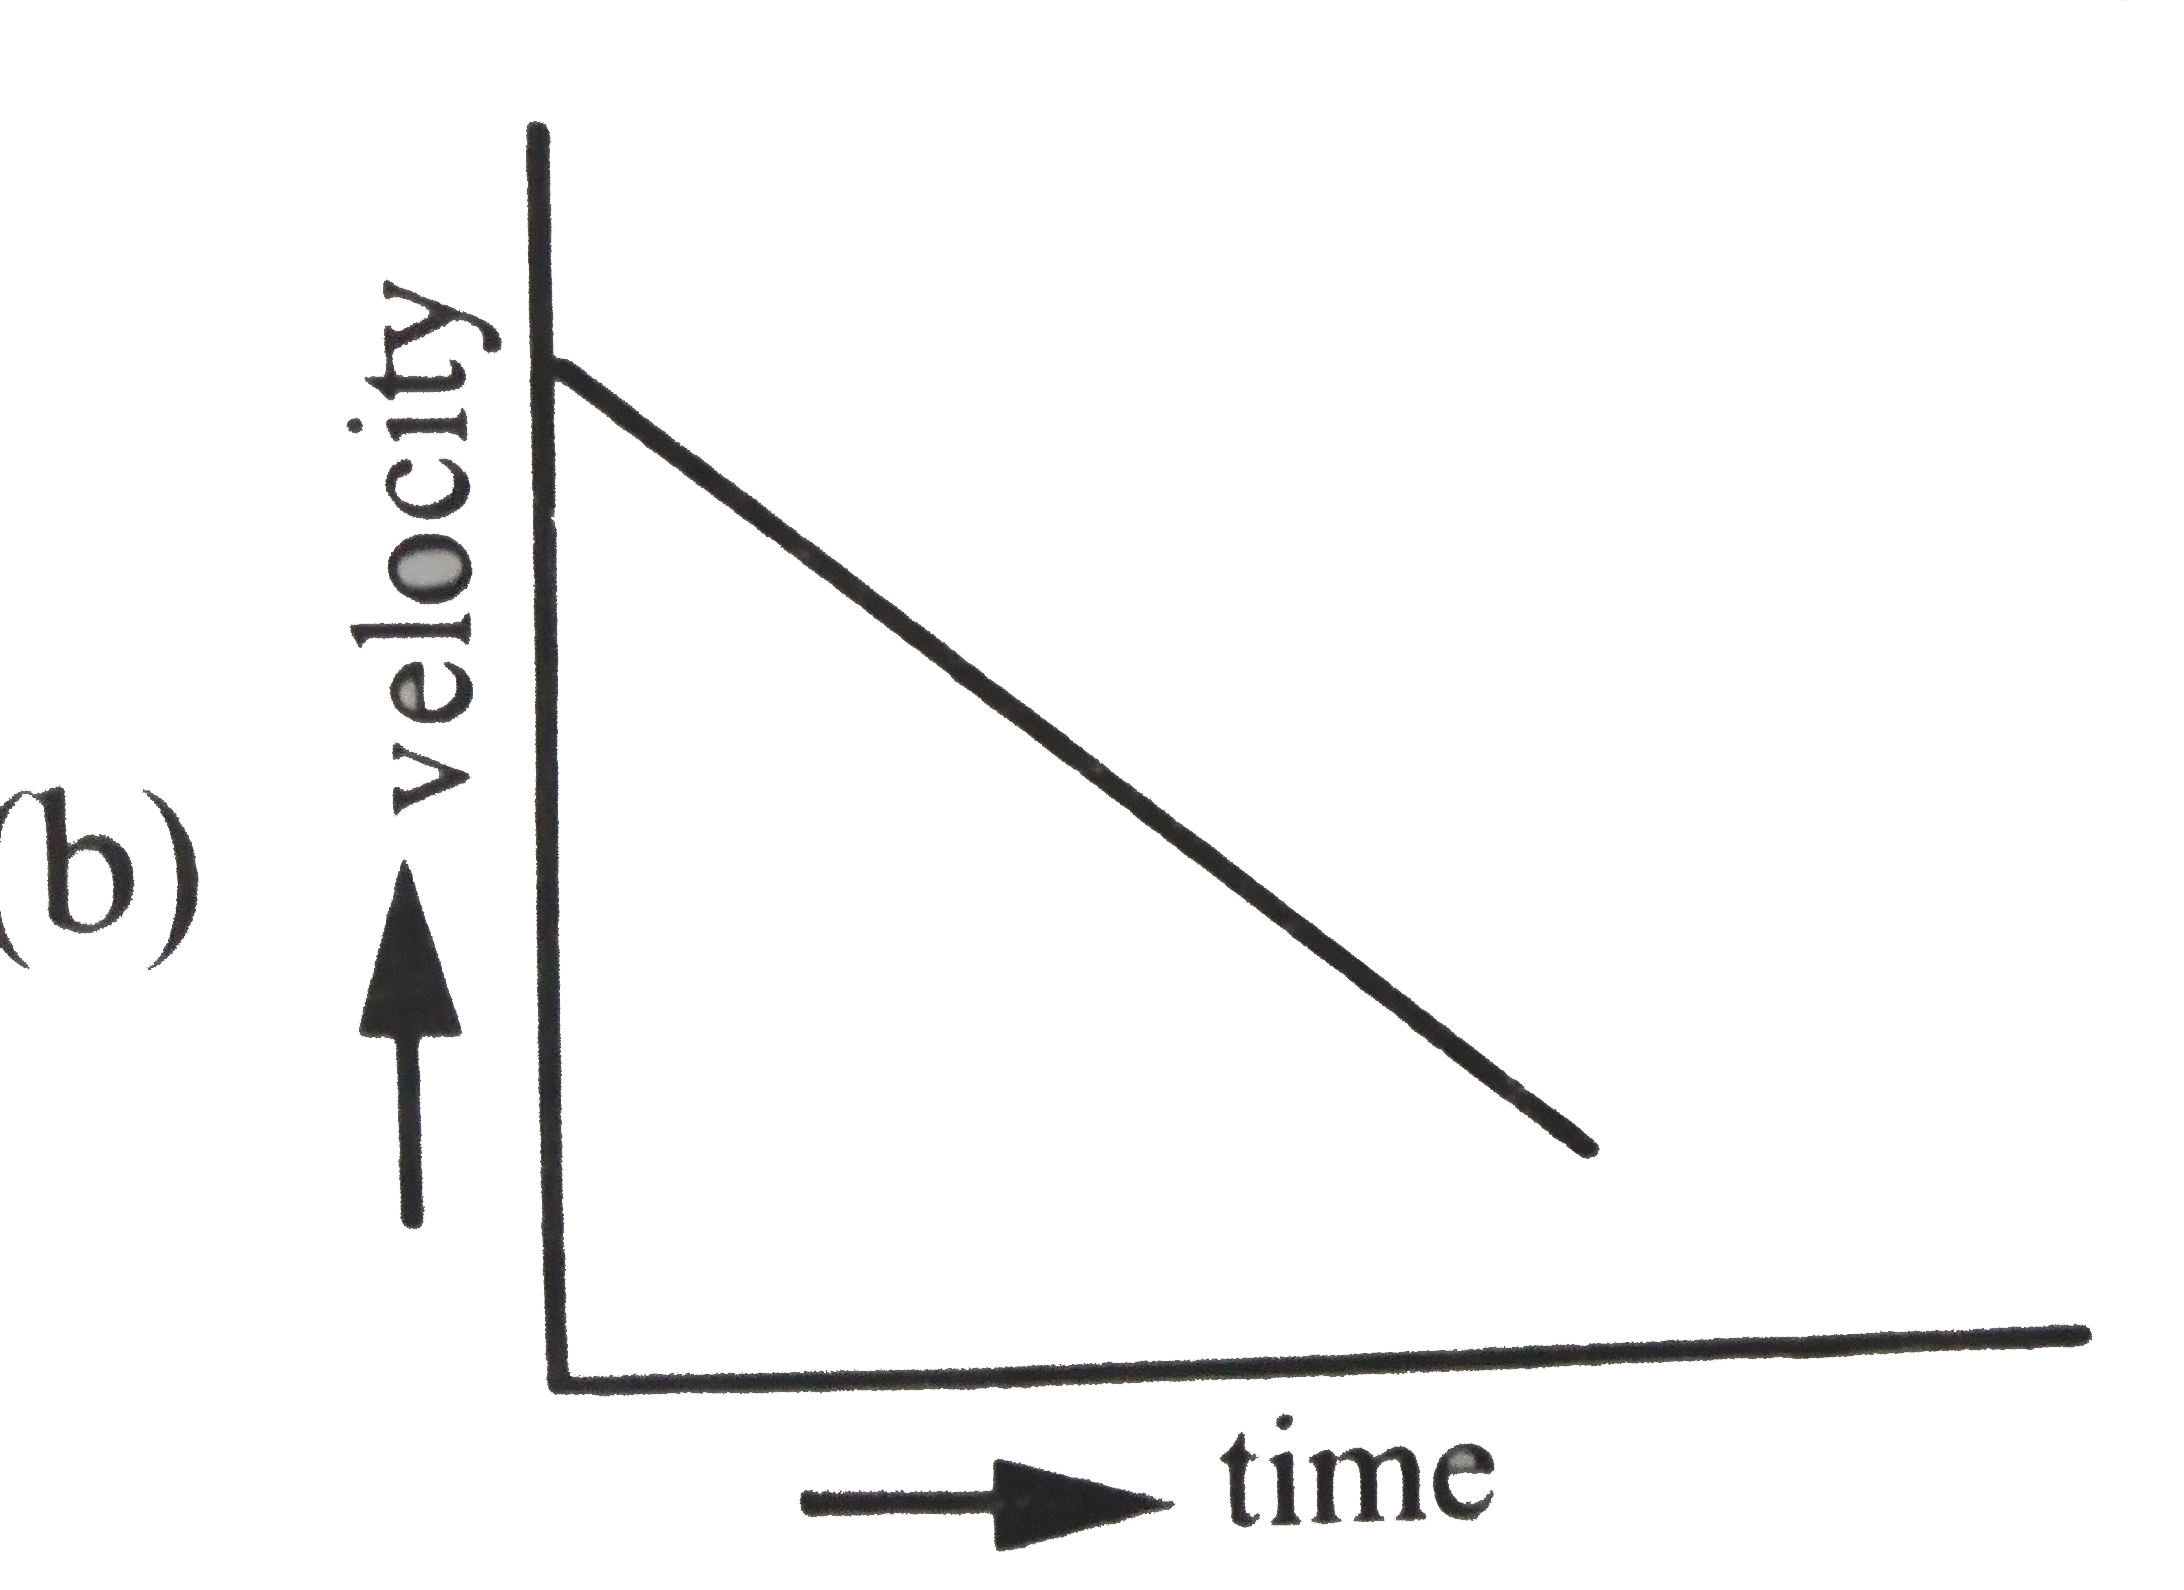 C
C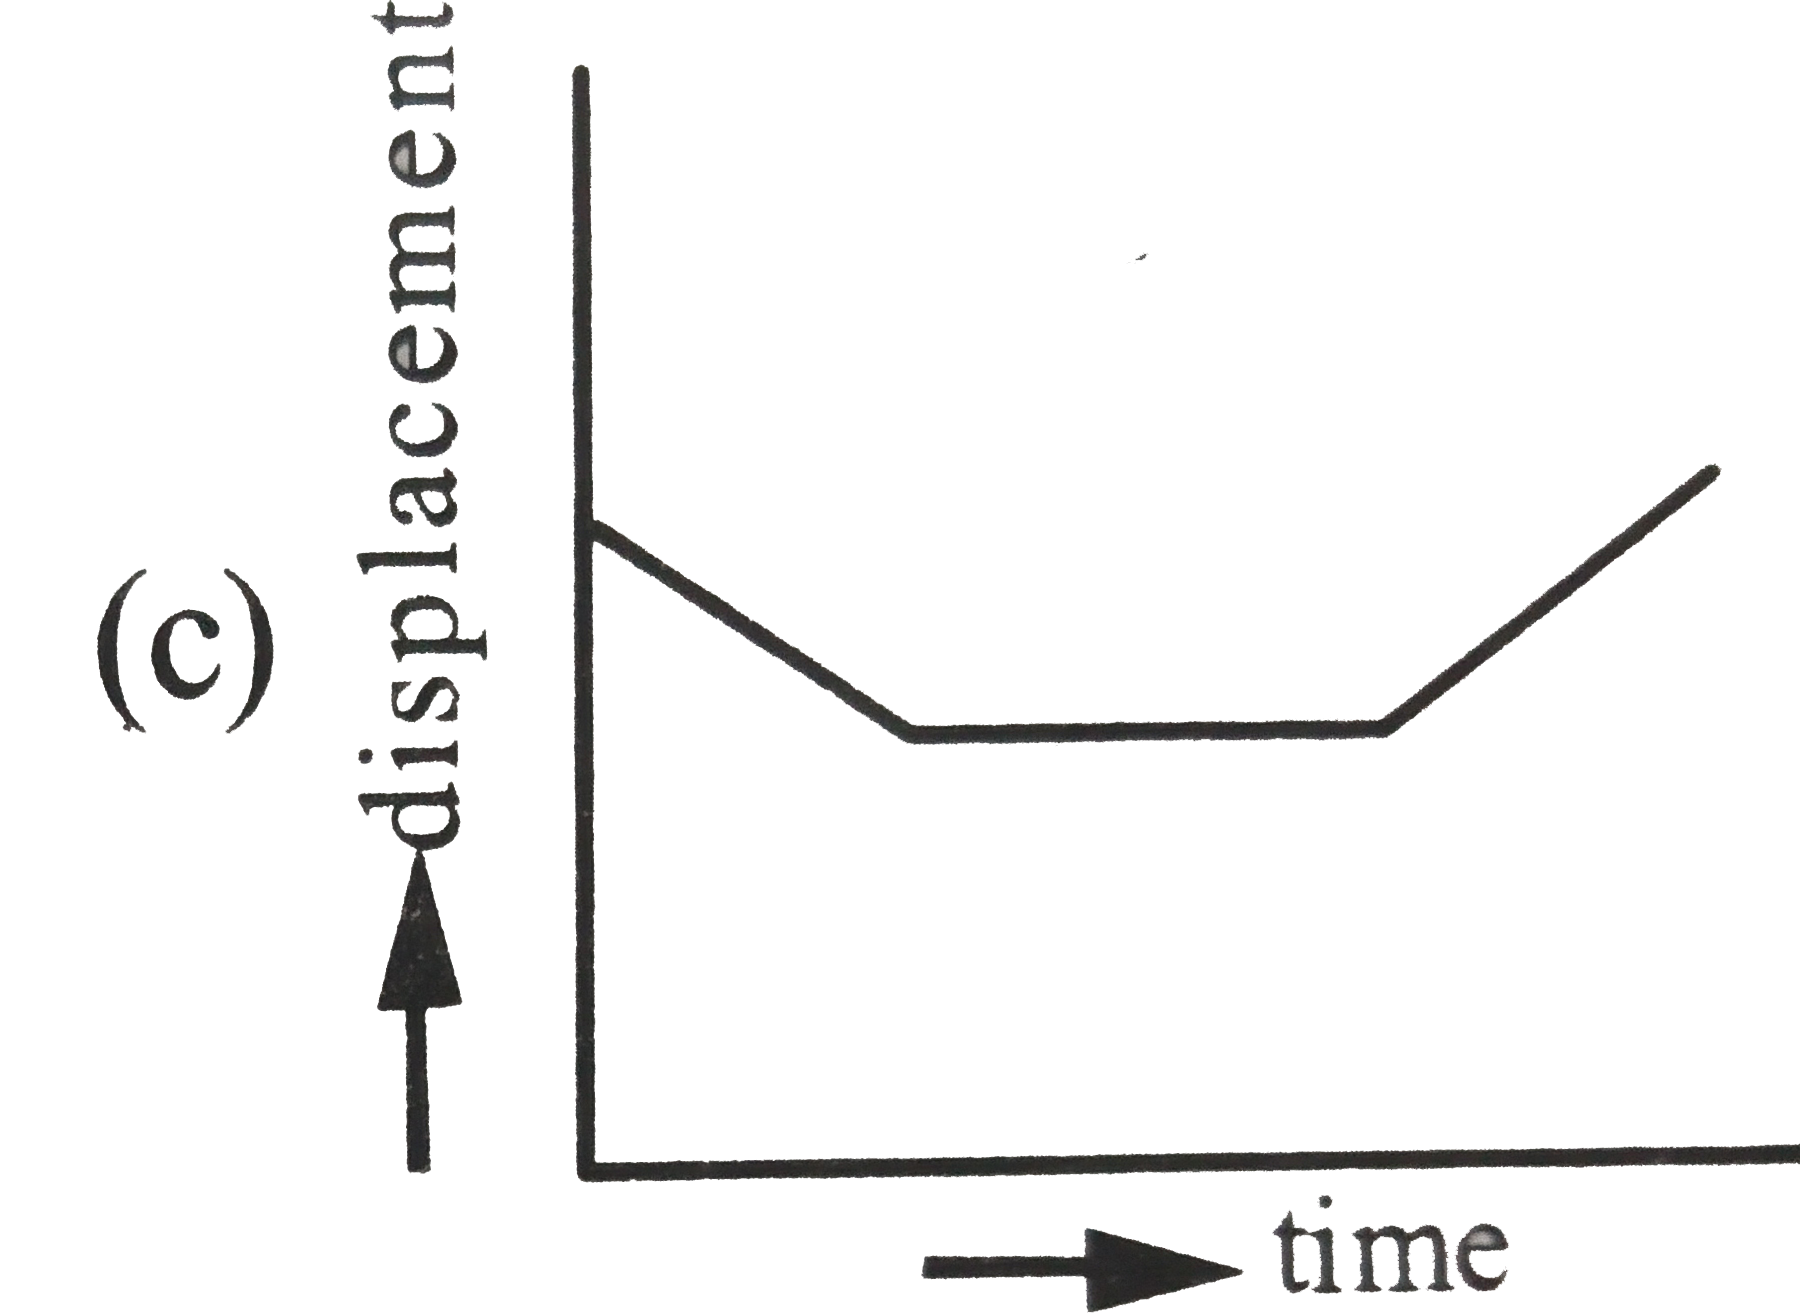 D
D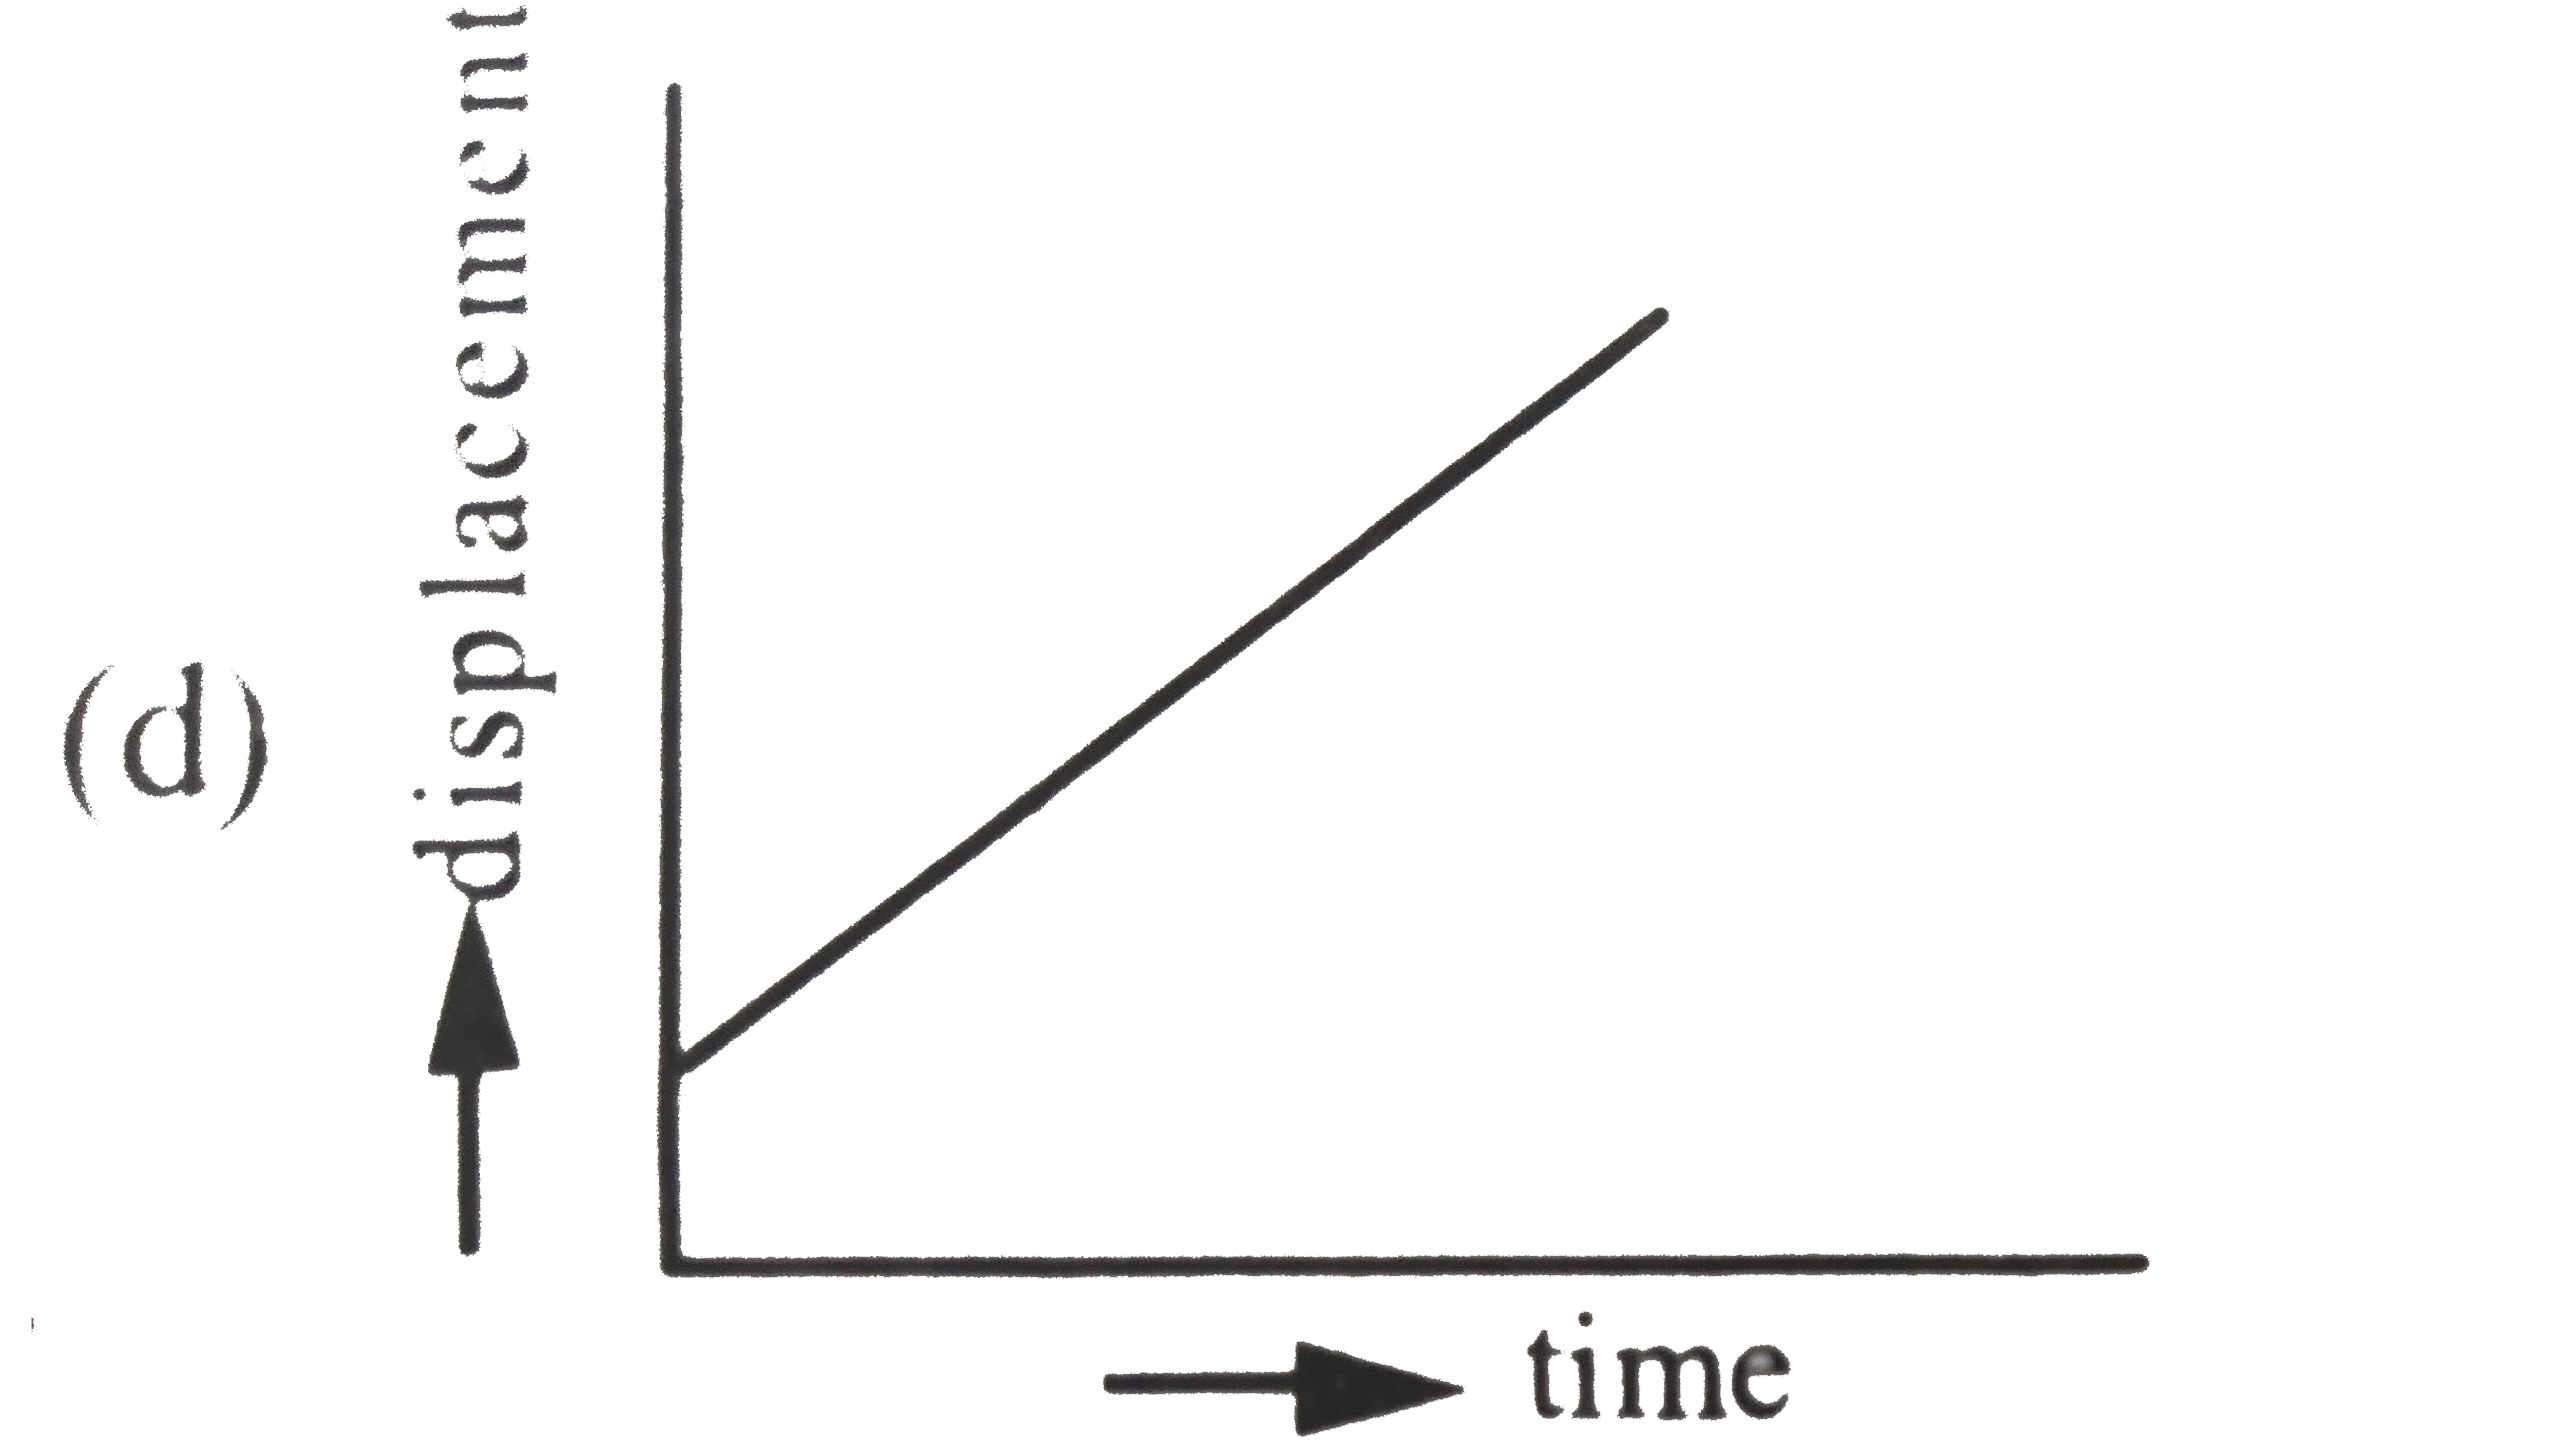
Which of the following curve will represent the variation of conductance C during titration of CH3COOH by gradual addition of NaOH solution (V)
A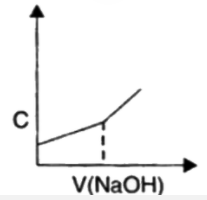 B
B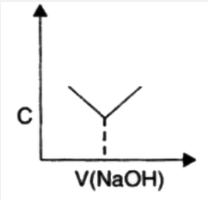 C
C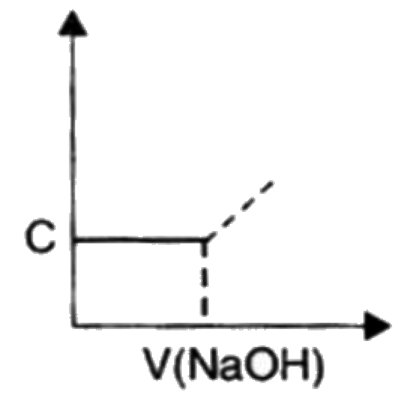 D
D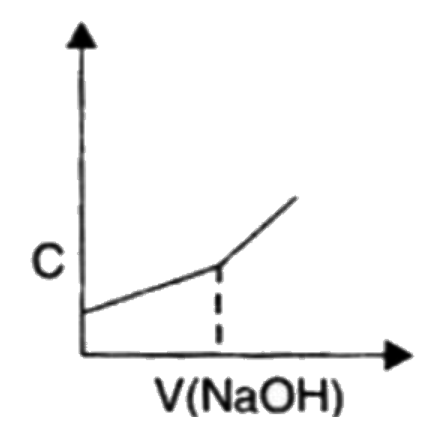
The graph of the function y=f(x). Then which of the following curve represent the graph of the function y=|f(x)|
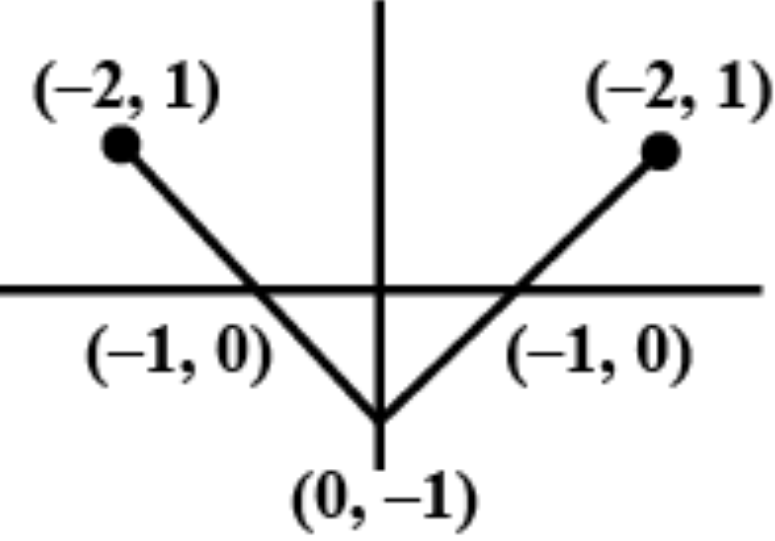
View SolutionWhich one of the following graphs represent a one-one function? (FIGURE)
View SolutionThe curve represents the titration of :
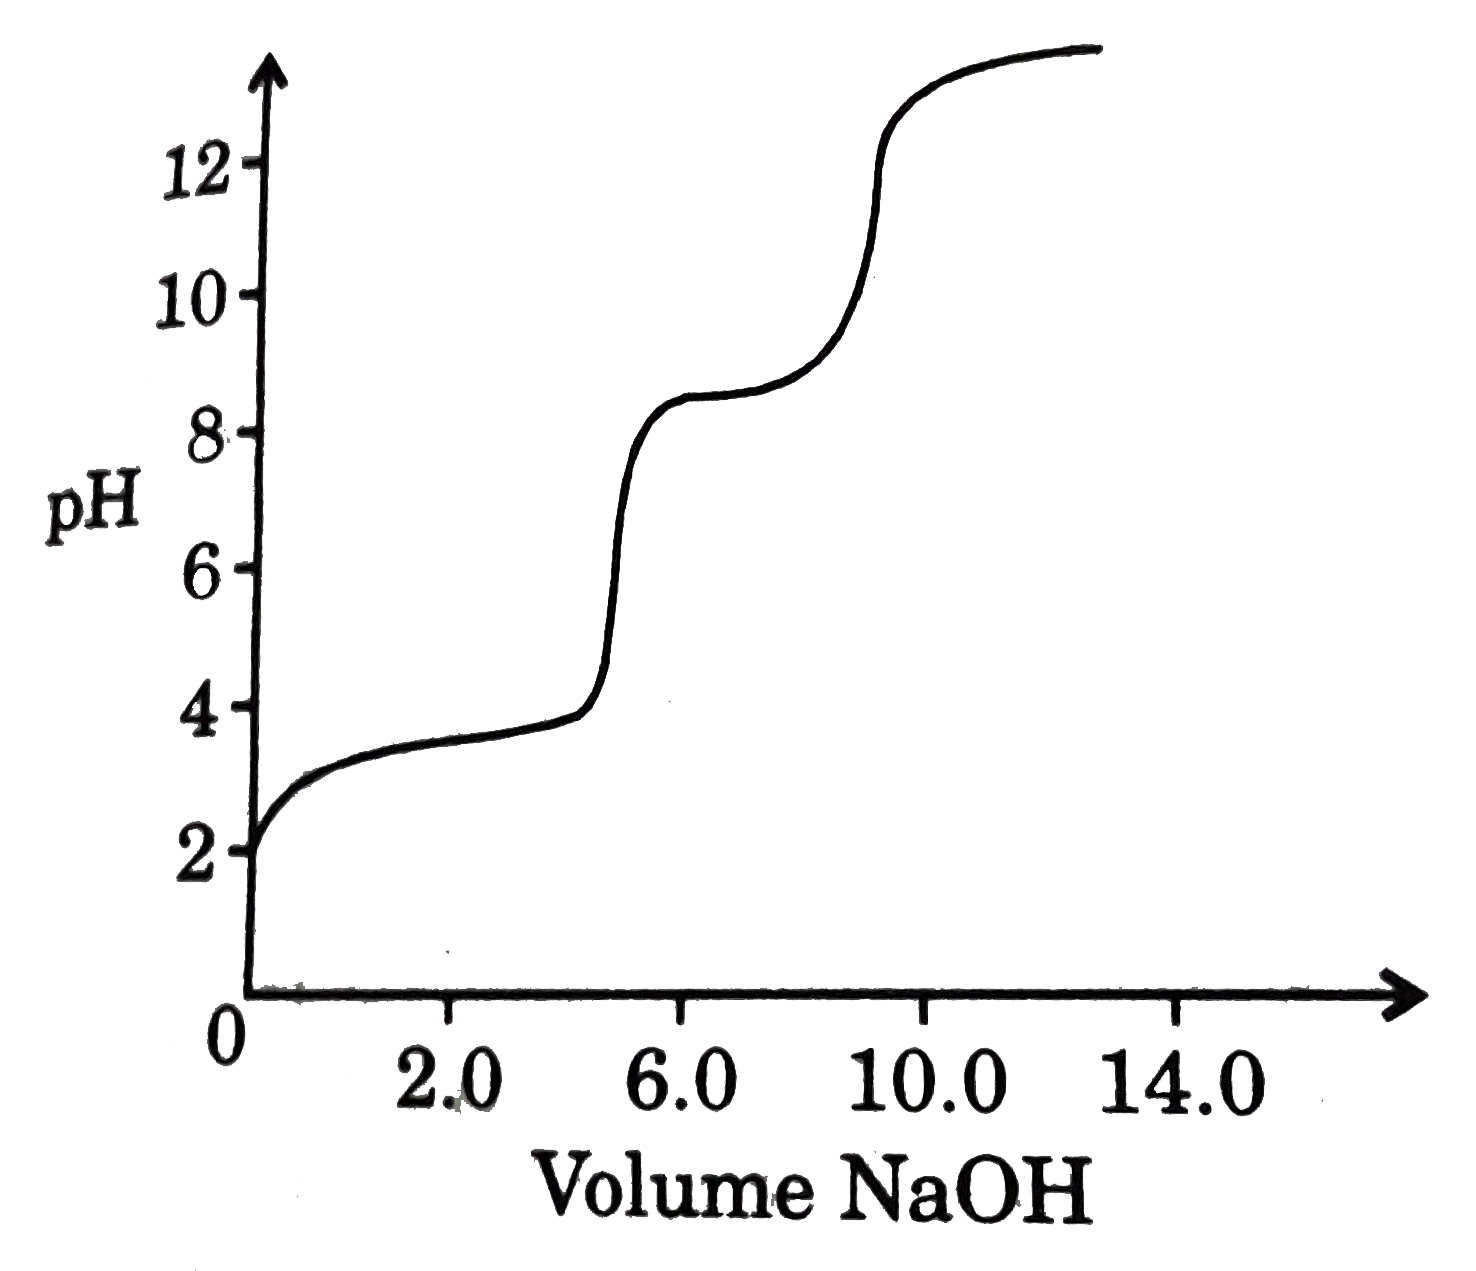
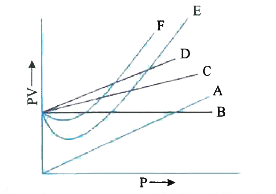
View SolutionWhich curve in the following graph represents the curve of ideal gas ?
View SolutionWhich of the following plot represents the graph of pH against volume of alkali added in the titration of NaOH and HCl
View Solution
