Which of the following plot is correct about the kinetic energy of photoelectrons ?


The correct Answer is:A
To solve the question regarding the correct plot of the kinetic energy of photoelectrons, we will analyze the photoelectric effect and the relationships involved.
1. Understanding the Photoelectric Effect:
- When light of a suitable frequency strikes a metal surface, it causes the ejection of electrons from that surface. These ejected electrons are called photoelectrons.
2. Energy Relation:
- The energy of the incident light (E) can be expressed as:
E=Work Function(ϕ)+Kinetic Energymax(KEmax)
- The work function (ϕ) is the minimum energy required to eject an electron from the metal surface.
3. Mathematical Representation:
- The energy of the incident light can also be expressed as:
E=hν
- Where h is Planck's constant and ν is the frequency of the light. The work function can be expressed as:
ϕ=hν0
- Here, ν0 is the threshold frequency.
4. Kinetic Energy Expression:
- Rearranging the energy equation gives:
KEmax=hν−hν0
- This can also be expressed in terms of wavelength (λ):
KEmax=hcλ−hν0
- Where c is the speed of light.
5. Relationship Between Kinetic Energy and Wavelength:
- From the equation, we see that as the wavelength decreases (or frequency increases), the kinetic energy increases. This indicates an inverse relationship between kinetic energy and wavelength.
6. Analyzing the Options:
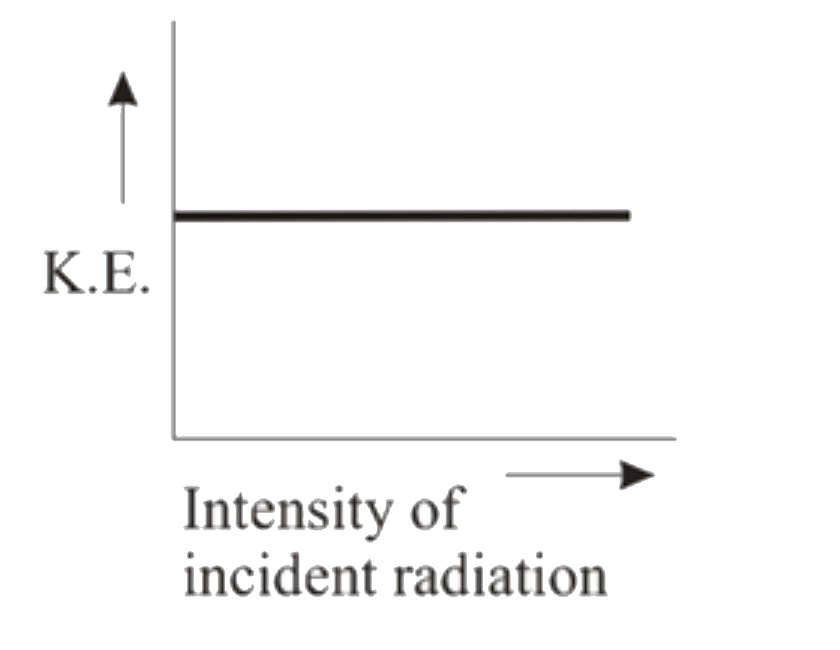
- Option 1: Kinetic energy vs. intensity - This plot is a horizontal line, indicating that kinetic energy does not change with intensity (only the number of photons increases).
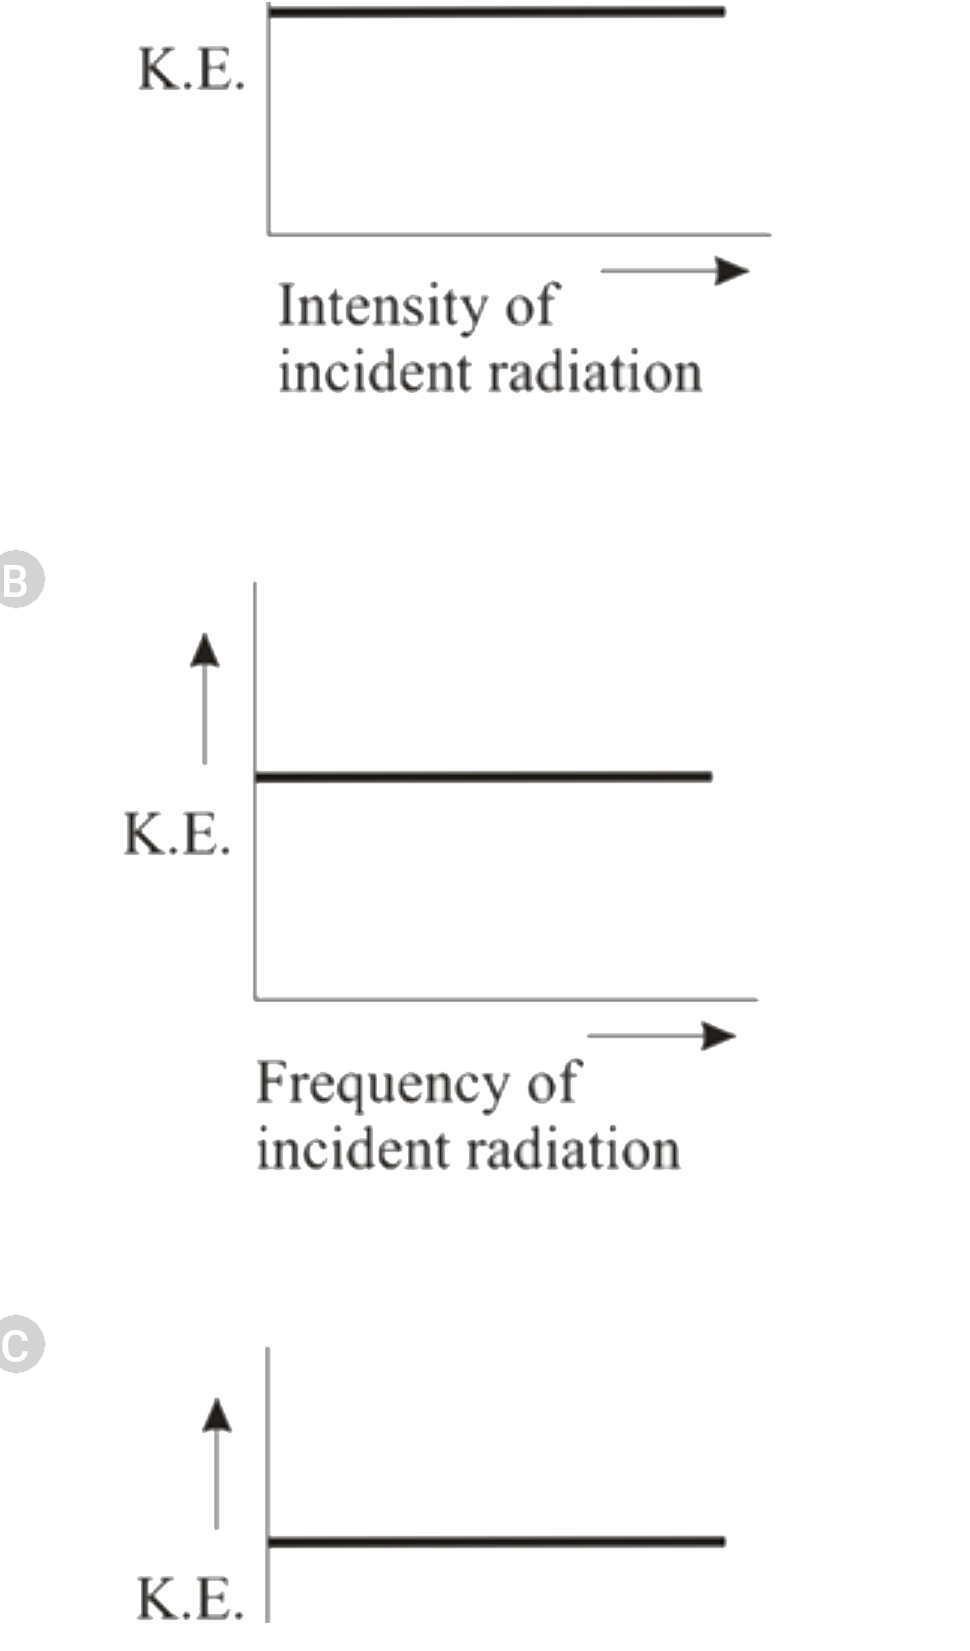
- Option 2: Kinetic energy vs. frequency - This should show a direct relationship (not a constant).
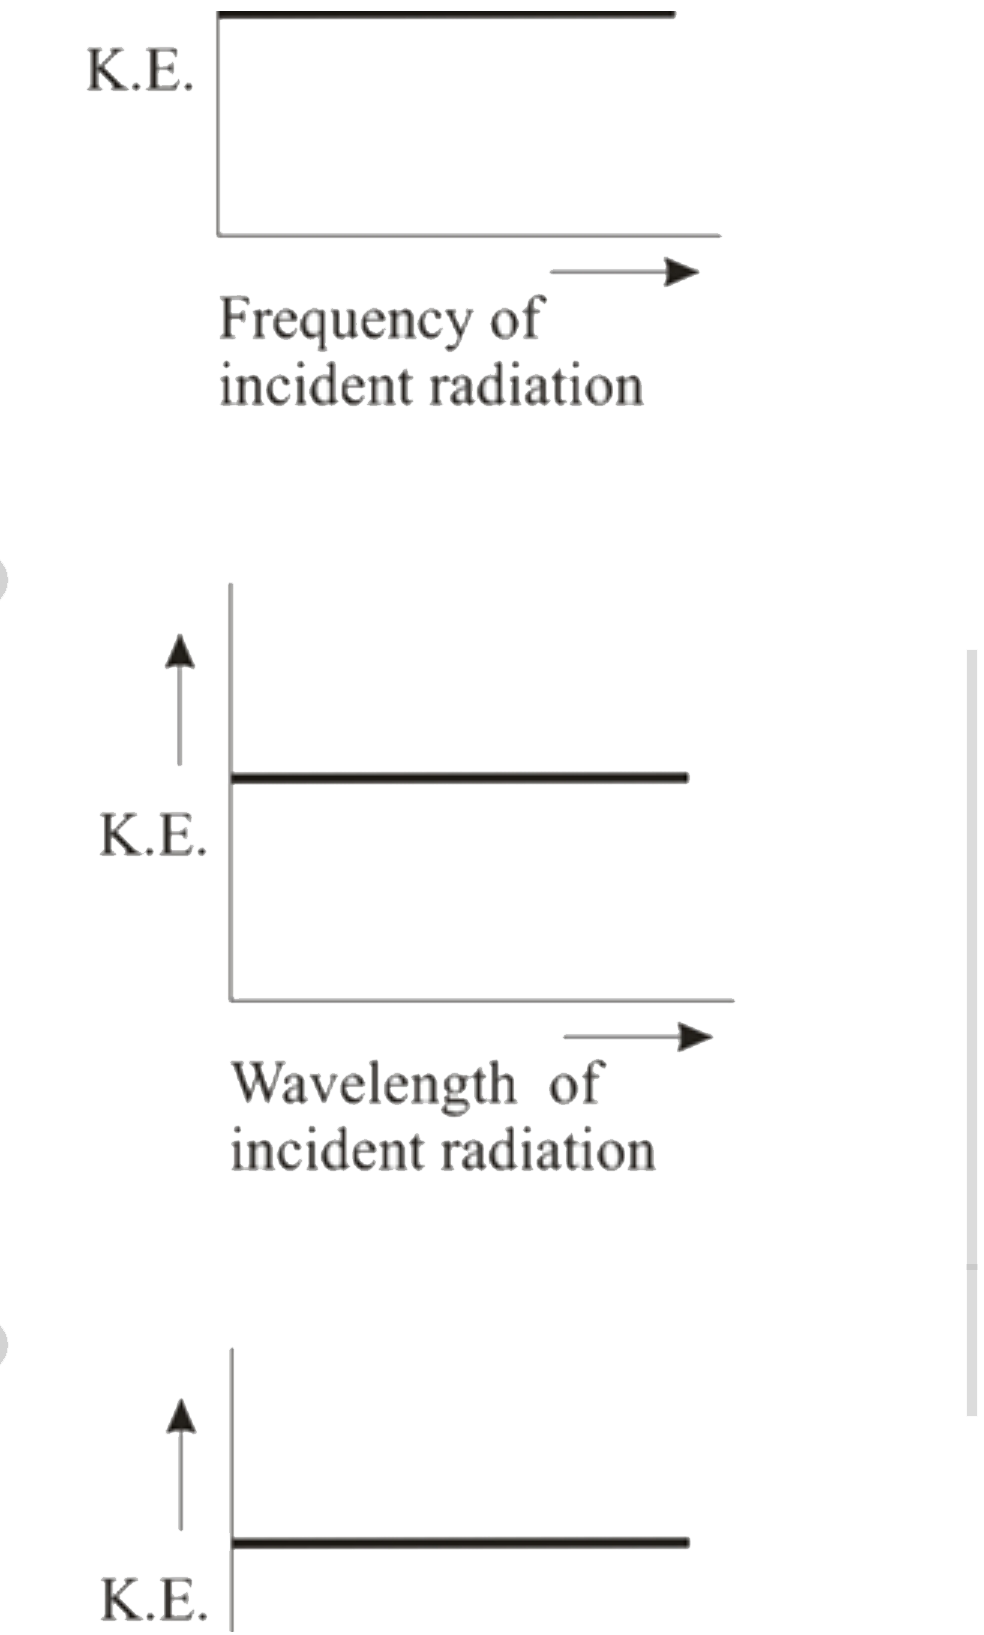
- Option 3: Kinetic energy vs. wavelength - This should show an inverse relationship (not a constant).
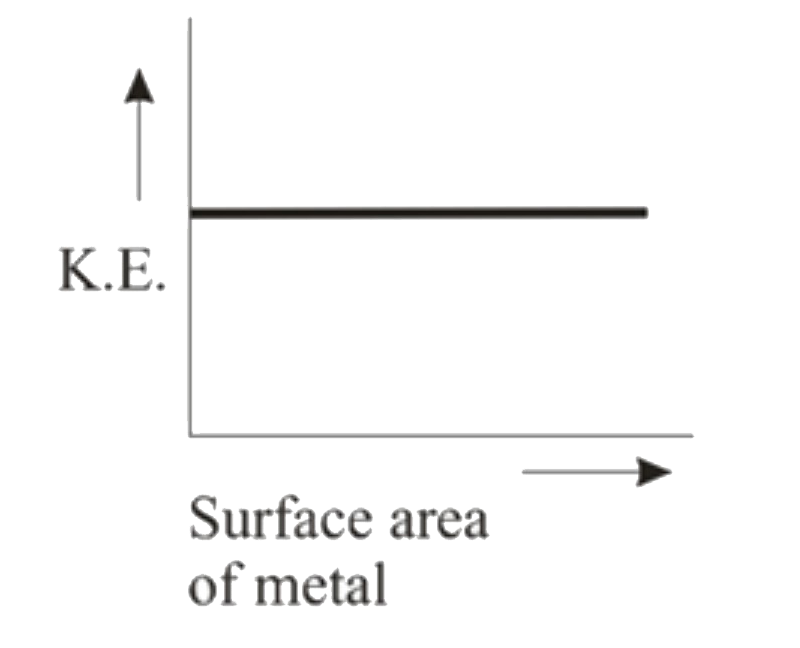
- Option 4: Kinetic energy vs. surface area - This is not relevant to the photoelectric effect.
7. Conclusion:
- The correct plot that represents the relationship of kinetic energy of photoelectrons is Option 1, which shows that kinetic energy remains constant with increasing intensity.
- When light of a suitable frequency strikes a metal surface, it causes the ejection of electrons from that surface. These ejected electrons are called photoelectrons.
- The energy of the incident light (E) can be expressed as:
E=Work Function(ϕ)+Kinetic Energymax(KEmax)
- The work function (ϕ) is the minimum energy required to eject an electron from the metal surface.
- The energy of the incident light can also be expressed as:
E=hν
- Where h is Planck's constant and ν is the frequency of the light. The work function can be expressed as:
ϕ=hν0
- Here, ν0 is the threshold frequency.
- Rearranging the energy equation gives:
KEmax=hν−hν0
- This can also be expressed in terms of wavelength (λ):
KEmax=hcλ−hν0
- Where c is the speed of light.
- From the equation, we see that as the wavelength decreases (or frequency increases), the kinetic energy increases. This indicates an inverse relationship between kinetic energy and wavelength.
- Option 1: Kinetic energy vs. intensity - This plot is a horizontal line, indicating that kinetic energy does not change with intensity (only the number of photons increases).
- Option 2: Kinetic energy vs. frequency - This should show a direct relationship (not a constant).
- Option 3: Kinetic energy vs. wavelength - This should show an inverse relationship (not a constant).
- Option 4: Kinetic energy vs. surface area - This is not relevant to the photoelectric effect.
- The correct plot that represents the relationship of kinetic energy of photoelectrons is Option 1, which shows that kinetic energy remains constant with increasing intensity.
Similar Questions
Knowledge Check
Which of the following is not correct about DNA?
AIt occurs in the cytoplasm of the cell.BThe sugar present is 2-deoxy D(-) ribose.CIt has a double strand a-helix.DIt has property of replication.
Which of the following plots is/are correct?
View SolutionWhich of the following is correct about biogas-
View SolutionWhich of the following is correct about legumes?
View SolutionWhich of the following is correct about symplast?
View SolutionWhich of the following is correct about phenylketonuria?
View SolutionWhich of the following is correct about the blastocyst ?
View SolutionWhich of the following is correct about the equlibrium ?
View Solution
