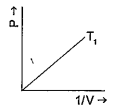
A graph representing variation of pressure with volume at particular temperature is given below.
Re-sketch the graph and include graphs for two temperature T2 and T3 : where T2>T1>T3.
 Solution in Malayalam
Step by step video & image solution for A graph representing variation of pressure with volume at particular temperature is given below. Re-sketch the graph and include graphs for two temperature T_2 and T_3 : where T_2>T_1>T_3. by Chemistry experts to help you in doubts & scoring excellent marks in Class 11 exams.
Similar Questions
Write the correct number in the given blanks from the following A.P.70,60,50,40. a=... t1=....,t2=....,t3=.... t2−t1=....andt3−t2=...., hence d=....
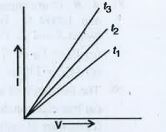
01:26View SolutionI−V graph for a metal at temperatures t1,t2,t3 are given
 . Temperatures are related as04:22View Solution
The current - voltage graphs for a given metallic wire at two different temperatures T_1 and T_2 are shown in the figure. The temperature T_2 is greater than T_1 .
01:29View SolutionArea of the triangle formed by the threepoints 't1'.'t2'and't3' on y2=4ax is K|(t1−t2)(t2−t3)(t3−t1)| then K=
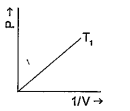
07:35View SolutionA graph representing variation of pressure with volume at particular temperature is given below.
Name the graph. 02:38View Solution
The vertices of a triangle are [a t_1t_2,a(t_1 +t_2)] , [a t_2t_3,a(t_2 +t_3)] , [a t_3t_1,a(t_3 +t_1)] Then the orthocenter of the triangle is (a) (-a, a(t_1+t_2+t_3)-at_1t_2t_3) (b) (-a, a(t_1+t_2+t_3)+at_1t_2t_3) (c) (a, a(t_1+t_2+t_3)+at_1t_2t_3) (d) (a, a(t_1+t_2+t_3)-at_1t_2t_3)
02:27View SolutionThe vertices of a triangle are [a t_1t_2,a(t_1 +t_2)] , [a t_2t_3,a(t_2 +t_3)] , [a t_3t_1,a(t_3 +t_1)] Then the orthocenter of the triangle is (a) (-a, a(t_1+t_2+t_3)-at_1t_2t_3) (b) (-a, a(t_1+t_2+t_3)+at_1t_2t_3) (c) (a, a(t_1+t_2+t_3)+at_1t_2t_3) (d) (a, a(t_1+t_2+t_3)-at_1t_2t_3)
05:58View Solution
