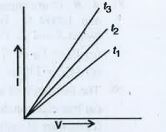
I−V graph for a metal at temperatures t1,t2,t3 are given
 . Temperatures are related asSolution in Kannada
t1>t2>t3
t1=t2=t3
t3>t2>t1
t1>t2>t3
Step by step video & image solution for I-V graph for a metal at temperatures t_1, t_2, t_3 are given . Temperatures are related as by Physics experts to help you in doubts & scoring excellent marks in Class 12 exams.
Similar Questions
The current - voltage graphs for a given metallic wire at two different temperatures T_1 and T_2 are shown in the figure. The temperature T_2 is greater than T_1 .
03:02View SolutionThe current - voltage graphs for a given metallic wire at two different temperatures T_1 and T_2 are shown in the figure. The temperature T_2 is greater than T_1 .
01:29View SolutionA graph representing variation of pressure with volume at particular temperature is given below. Re-sketch the graph and include graphs for two temperature T_2 and T_3 : where T_2>T_1>T_3 .
04:01View SolutionThe vertices of a triangle are [a t_1t_2,a(t_1 +t_2)] , [a t_2t_3,a(t_2 +t_3)] , [a t_3t_1,a(t_3 +t_1)] Then the orthocenter of the triangle is (a) (-a, a(t_1+t_2+t_3)-at_1t_2t_3) (b) (-a, a(t_1+t_2+t_3)+at_1t_2t_3) (c) (a, a(t_1+t_2+t_3)+at_1t_2t_3) (d) (a, a(t_1+t_2+t_3)-at_1t_2t_3)
02:27View SolutionV-I graph for a mettalic wire at two different temperatures T1 and T2 is as shown in figure. WHich of the temperatures T1 and T2 is higher and why.
 02:15View Solution
The vertices of a triangle are [a t_1t_2,a(t_1 +t_2)] , [a t_2t_3,a(t_2 +t_3)] , [a t_3t_1,a(t_3 +t_1)] Then the orthocenter of the triangle is (a) (-a, a(t_1+t_2+t_3)-at_1t_2t_3) (b) (-a, a(t_1+t_2+t_3)+at_1t_2t_3) (c) (a, a(t_1+t_2+t_3)+at_1t_2t_3) (d) (a, a(t_1+t_2+t_3)-at_1t_2t_3)
05:58View SolutionIf t1,t2,t3 are in A.P. (a,d) and T1,T2,T3 are in H.P. then the value of
Δ=∣∣ ∣∣t1−T1t1−T2t1−T3t2−T1t2−T2t2−T3t3−T1t3−T2t3−T3∣∣ ∣∣03:44View Solution

