Different curves of volume vs temperature at constant pressure are called
Isotherm
Isobar
Isochore
Isotope
The correct Answer is:B
Similar Questions
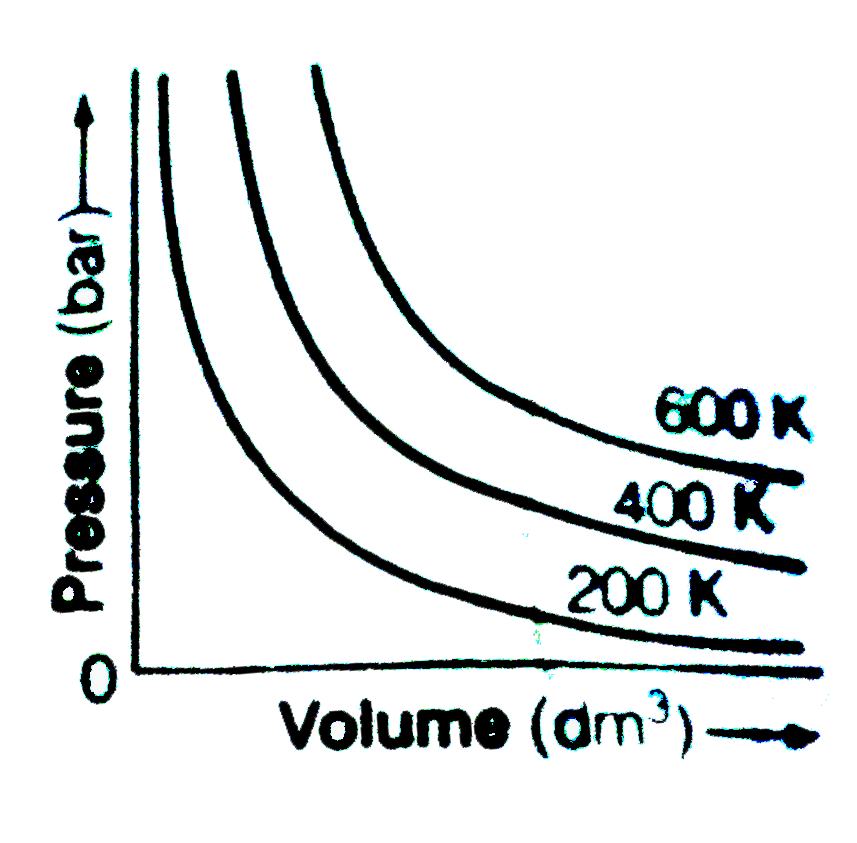
The variation of pressure with volume of the gas at different temperatures can be graphically represented as shown in figure. On the basis of this graph answer the following question.
(i) How will the volume of a gas change if its pressure is increased at constant temperature ?
(ii) At a constant pressure, how will the volume of a gas change if the temperature is increased from 200 K to 400 K ?

View SolutionThe variation of pressure with volume of the gas at different temperatures can be graphically represented as shown in figure. On the basis of this graph answer the following question.
(i) How will the volume of a gas change if its pressure is increased at constant temperature ?
(ii) At a constant pressure, how will the volume of a gas change if the temperature is increased from 200 K to 400 K ?

View Solution
Knowledge Check
Heat exchanged in a chemical reaction at constant temperature and pressure is called
AInternal energyBEnthalpyCEntropyDFree energyThe difference between heats of reaction at constant pressure and constant volume for a given reaction is
A(Δng)RTB(Δng)R/TC(Δng)T/RDΔngRT2A diatomic gas undergoes same change of temperature by two different processes (i) at constant volume and (ii) at constant pressure. The heat supplied in the two cases will be in the ratio of
A1:1B3:5C5:7D7:5
A diatomic gas undergoes same change of temperature by two different processes (i) at constant volume and (ii) at constant pressure. The heat supplied in the two cases will be in the ratio of
View SolutionAssertion: The plot of volume (V) versus pressure (P) at constant temperature is a hyperbola in the first quadrant.
Reason: V∝1/P at constant temperature.
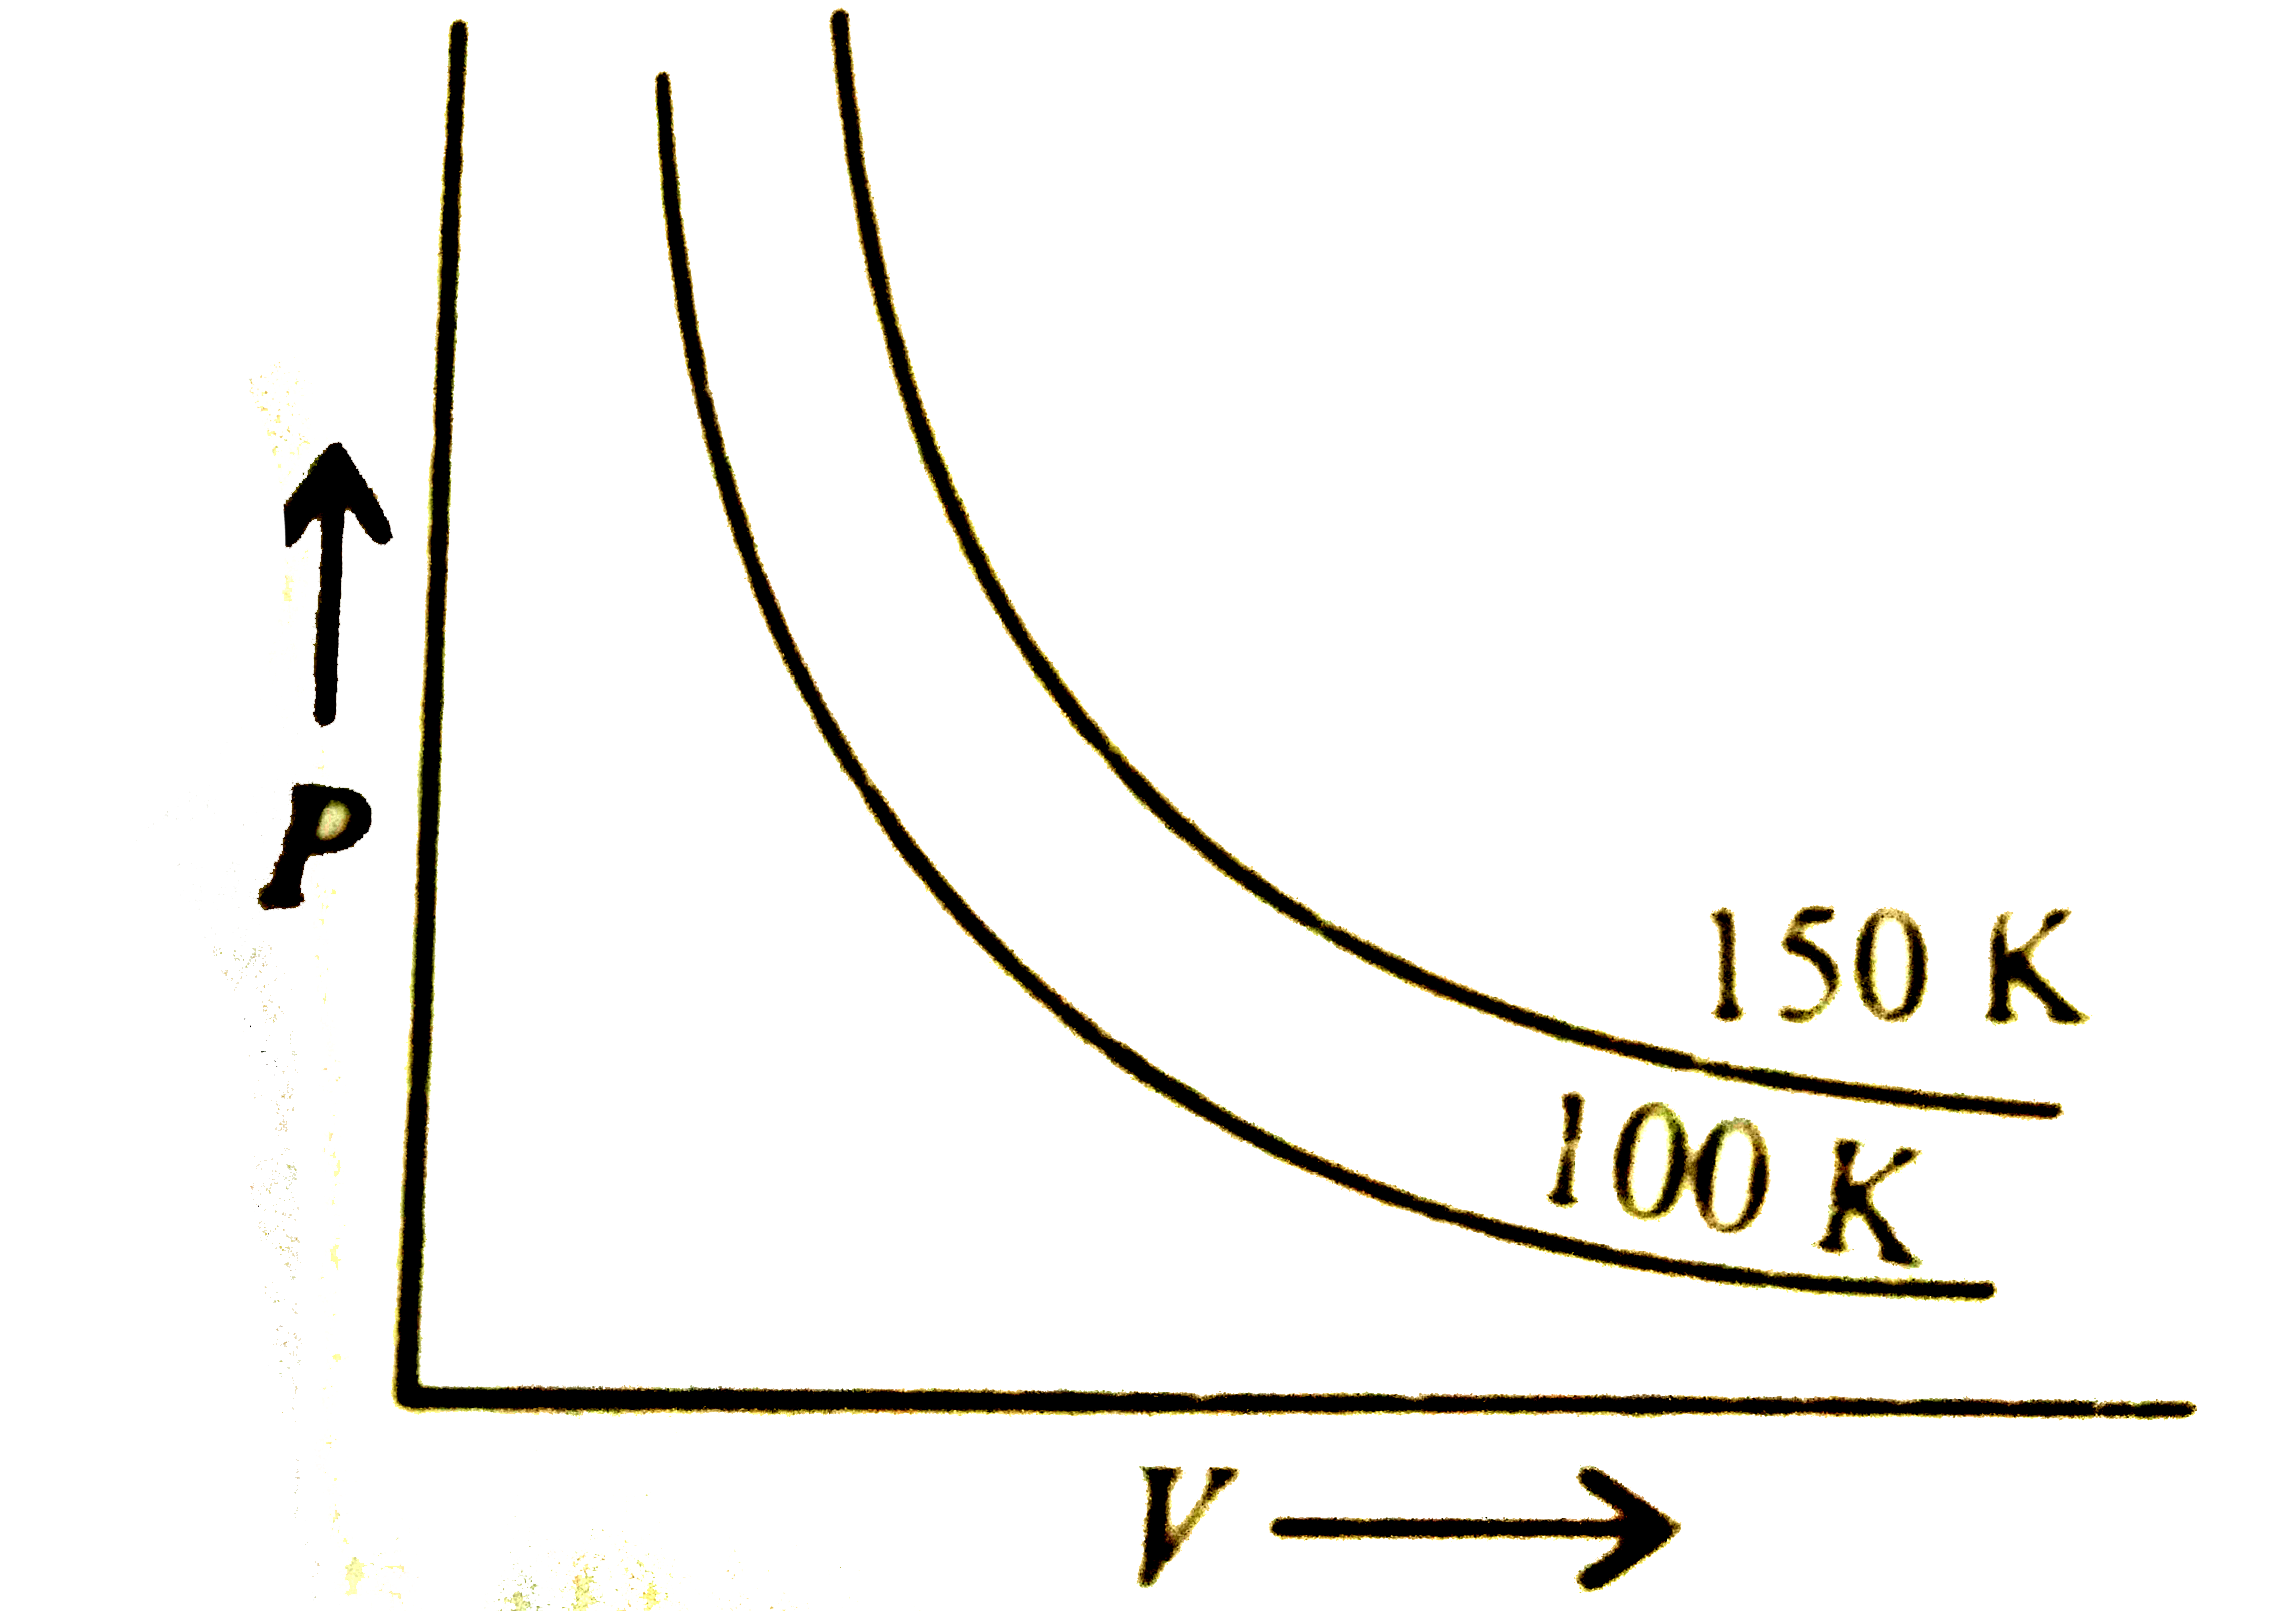
View SolutionA graph is plotted between pressure and volume at different temperatures . On the basis of the graph what changes will you observe in the volume if
(i) the pressure is increased at constant temperature .
(ii) the temperature is decreased at constant pressure .

View SolutionA graph of x/m vs pressure at constant temperature is called adsorption isotherm.Explain
View SolutionThe curve between adsorption and pressure at constant temperature is called as
View Solution
