In pie diagram all items are change in-
length
lines
square
degrees
The correct Answer is:D
Similar Questions
The item-wise expenditure of a Non-Government Organisation for the year 2008 - 2009 is given below:
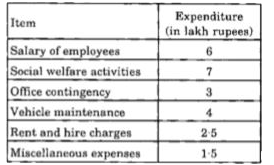
The above data are represented by a pie diagram.
What is the difference in the sectorial angles of the largest and smallest sectors ?
View SolutionIn a pie diagram, there are four slices with angles 150∘,90∘,60∘and60∘. A new pie diagram is formed by deleting one of the slices having angle 60∘ in the given pie diagram. In the new pie diagram
View Solution
Knowledge Check
If the monthly expenditure pattern of a person who earns a monthyl salary of Rs 15000 is represented in a pie diagram, then the sector angle of an item on transport expenses meassures 15∘. What is his monthely expenditure on transport?
ARs 450BRs 625CRs 675Dcannot be computed from the given dataRead the following pie diagrams carefully and answer the questions that follow . Following two pie diagrams show the religion were distribution of workers in two states.
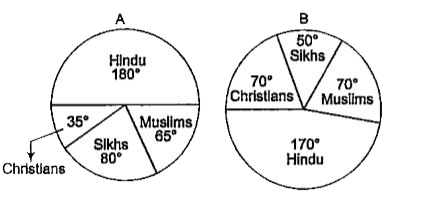
The percentage of Hindus in state A isA50%B30%C160%DNone of theseRead the following pie diagrams carefully and answer the questions that follow . Following two pie diagrams show the religion were distribution of workers in two states.
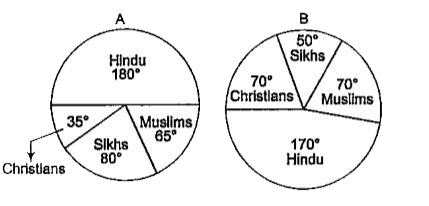
The percentage of Muslims in state B isA19%B70%C19.44%DNone of these
The item-wise expenditure of a Non-Government Organisation for the year 2008 - 2009 is given below:
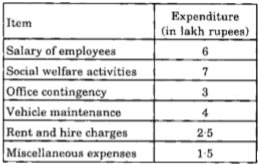
The above data are represented by a pie diagram.
What is the sectorial angle of the largest sector ?
View SolutionRead the following pie diagrams carefully and answer the questions that follow . Following two pie diagrams show the religion were distribution of workers in two states.
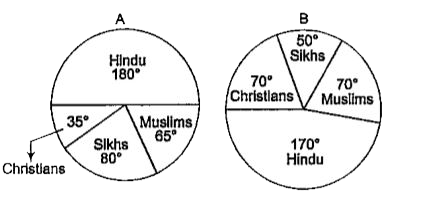
The percentage difference between Sikh population in the two states is
View SolutionRead the following pie diagrams carefully and answer the questions that follow . Following two pie diagrams show the religion were distribution of workers in two states.
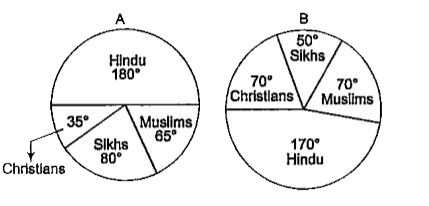
If the population of the state B is 540000, then the Muslims population is
View SolutionRead the following pie diagrams carefully and answer the questions that follow . Following two pie diagrams show the religion were distribution of workers in two states.

The percentage of Hindus in state A is
View SolutionRead the following pie diagrams carefully and answer the questions that follow . Following two pie diagrams show the religion were distribution of workers in two states.

The percentage of Muslims in state B is
View Solution
