The item-wise expenditure of a Non-Government Organisation for the year 2008 - 2009 is given below:
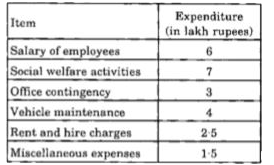
The above data are represented by a pie diagram.
What is the difference in the sectorial angles of the largest and smallest sectors ?
90∘
85∘
82.5∘
77.5∘
Step by step video & image solution for The item-wise expenditure of a Non-Government Organisation for the year 2008 - 2009 is given below: The above data are represented by a pie diagram. What is the difference in the sectorial angles of the largest and smallest sectors ? by Maths experts to help you in doubts & scoring excellent marks in Class 14 exams.
Updated on:21/07/2023Similar Questions
The item-wise expenditure of a Non-Government Organisation for the year 2008 - 2009 is given below:
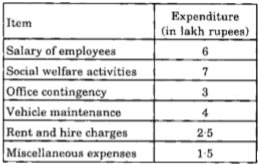
The above data are represented by a pie diagram.
What is the sectorial angle of the largest sector ?
View SolutionThe table below gives the number of members of a club classified by sex and nativity :
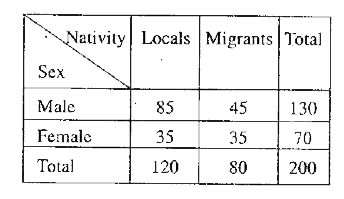
The above data are represented by a pie diagram. What is the sectorial angle of the area representing male-migrant category ?
View Solution
Knowledge Check
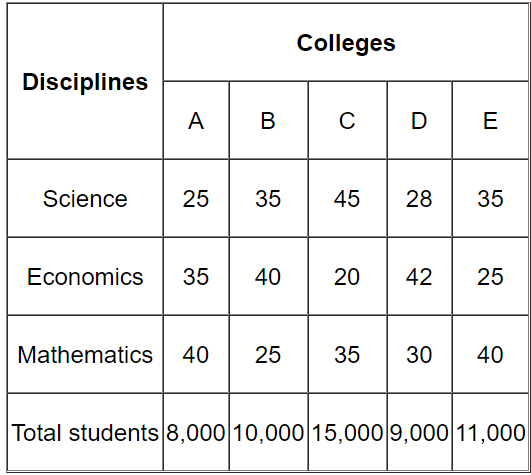
IF the data of the total students college wise, is represented by a pie chart, what is the central angle of the sector representing college E.
 A78∘B75∘C79∘D73∘
IF the data about students of the commerce stream in all colleges is represented by a pie chart. What is the central angle of the sector representing college D, to the nearest degree
A66∘B82∘C88∘D85∘
Annual expenditure of a company in the year 2007-2008 is given below:
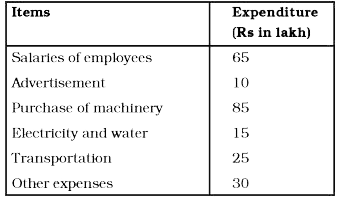
Prepare a pictograph of the above data using an appropriate symbol to represent Rs 10 lakh.
View SolutionThe monthly expenditure of a person is 6,000. The distribution of expenditure on various items is as follows :
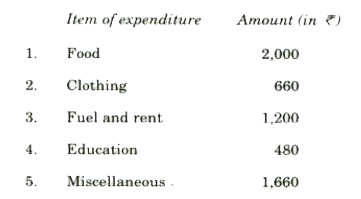
If the above data is represented by a percentage bar diagram of height 15 cm, then what are the lengths of the two segments of the bar diagram corresponcling to education and miscellaneous respectively?
View SolutionThe expenditure of a family of different heads in a month is given below

Draw a bar graph to represent the data above.
View SolutionArea under different crops n a certain village is given below : Represent, it by a pie diagram:
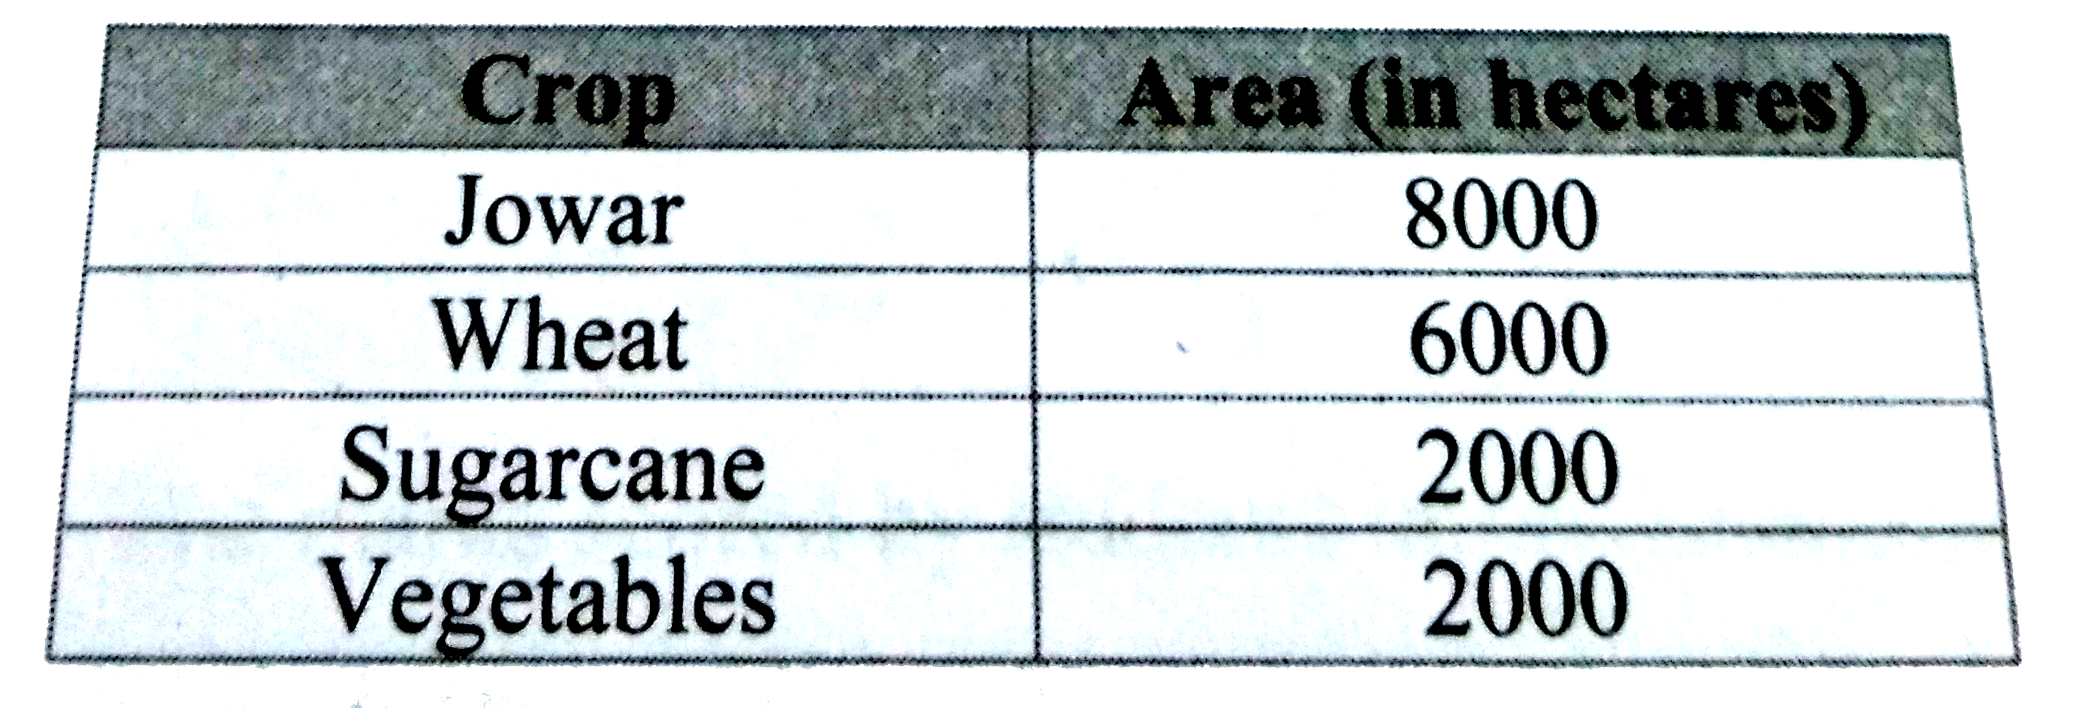
View SolutionArea under different crops n a certain village is given below : Represent, it by a pie diagram:

View SolutionArea under different crops in a certain village is given below. Represent it by a pie diagram:

View Solution
