The following diagram is known as
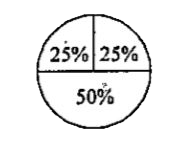
A
Histogram
B
Ogive
C
Map
D
Pie diagram.
Text Solution
The correct Answer is:D
|
Similar Questions
Knowledge Check
In the following diagram
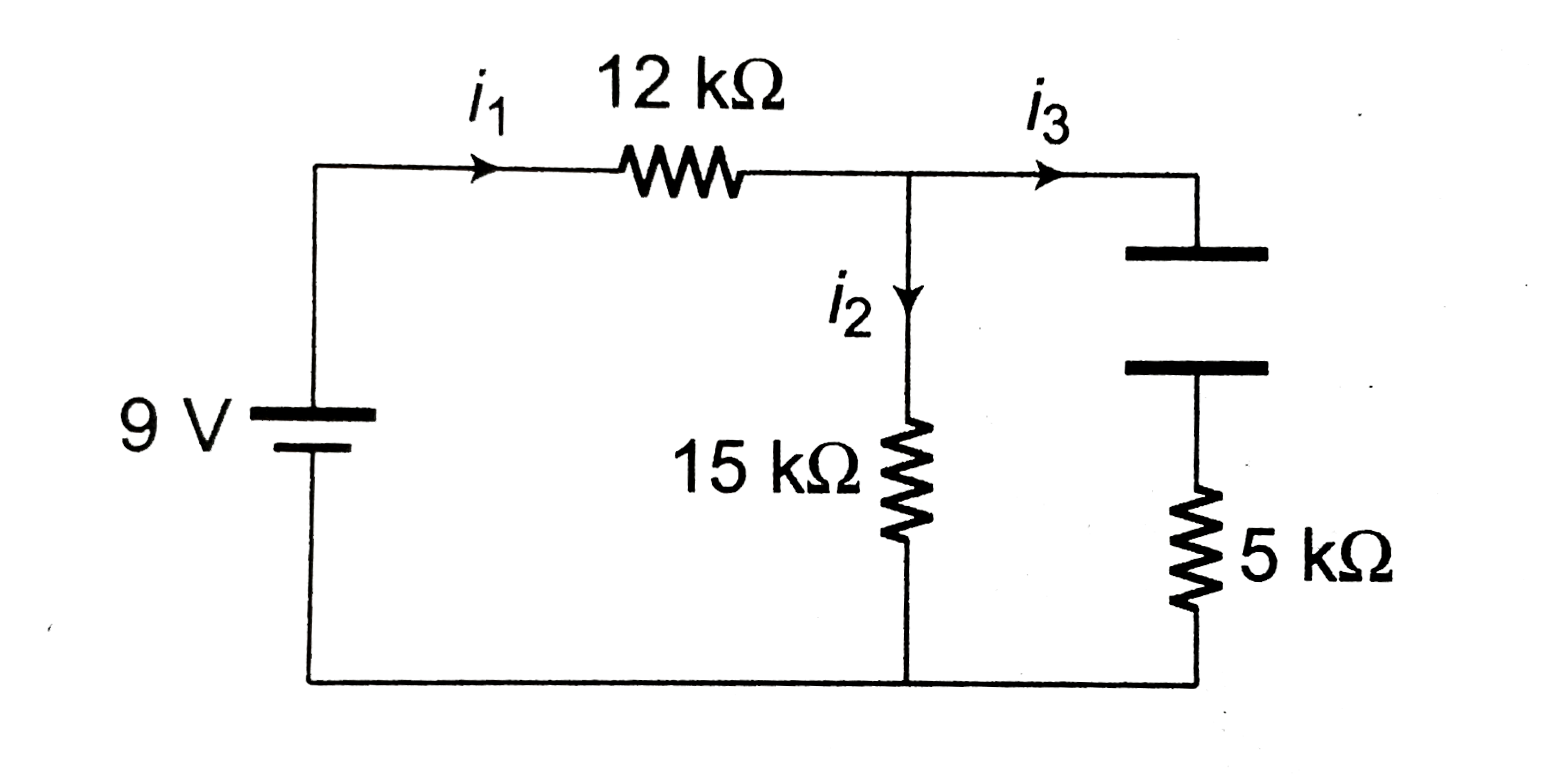 Ai1=13mABi2=13mACi3=0Dall
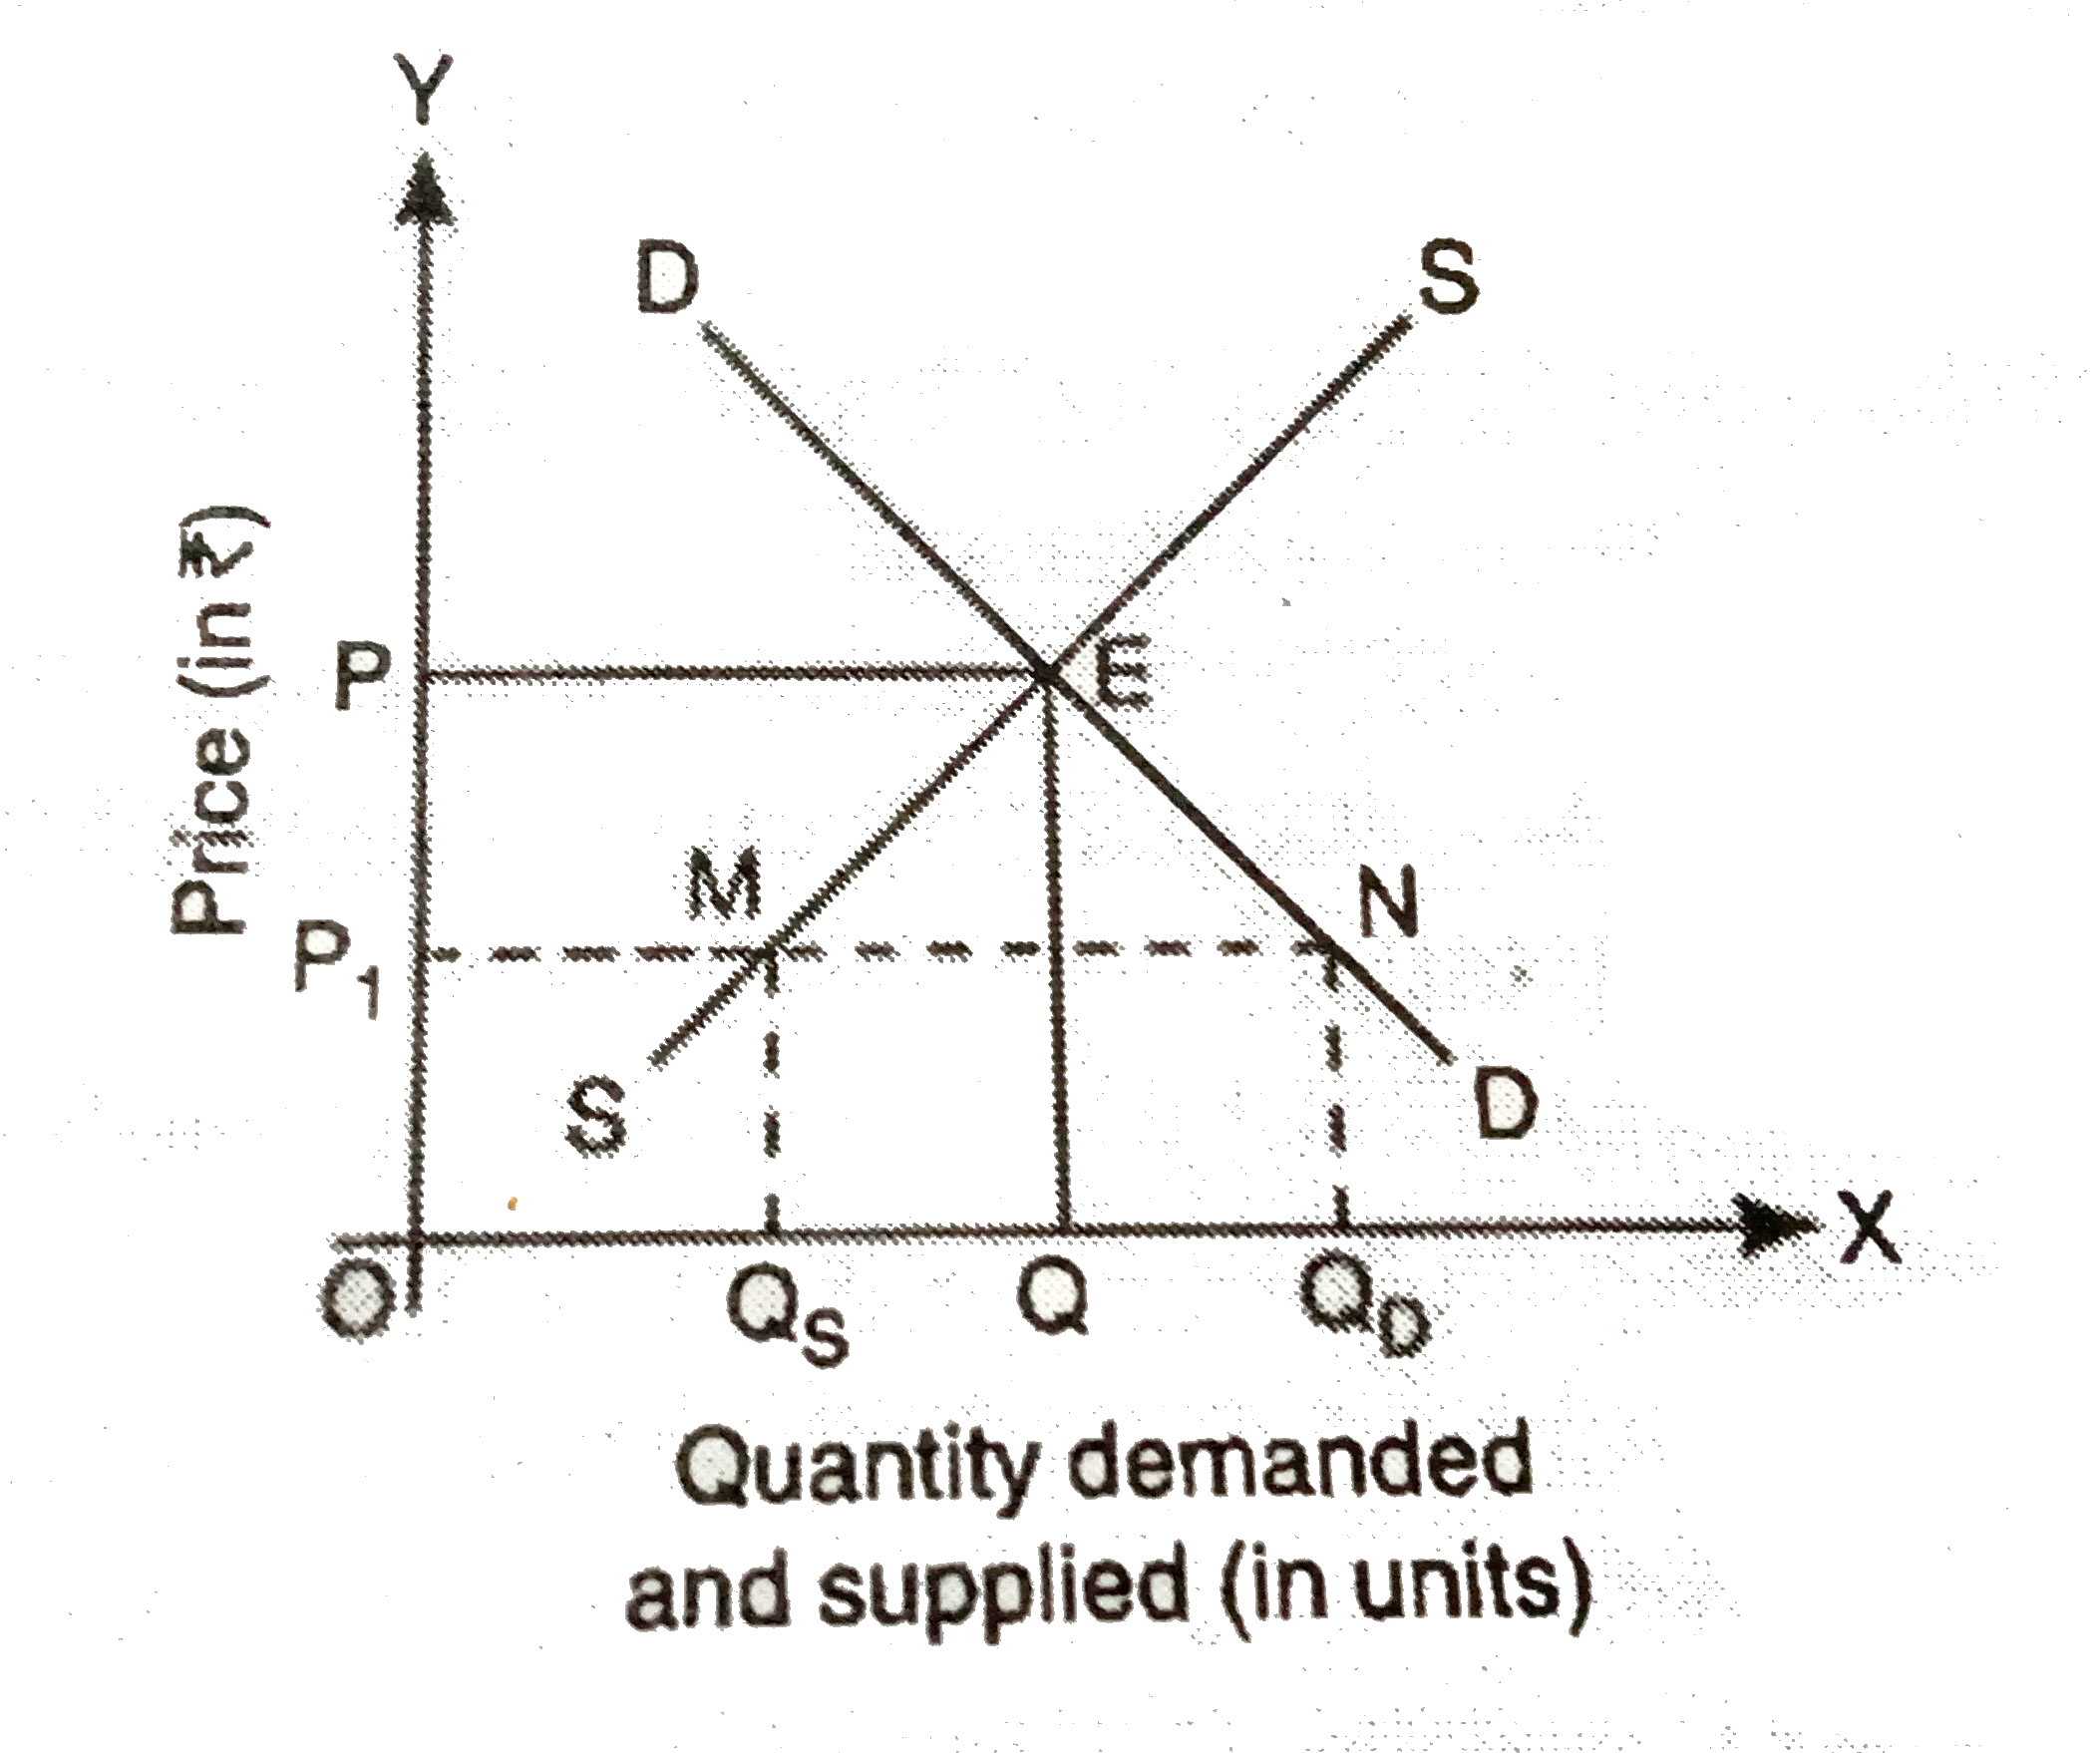
The following diagram depicts the situation of :
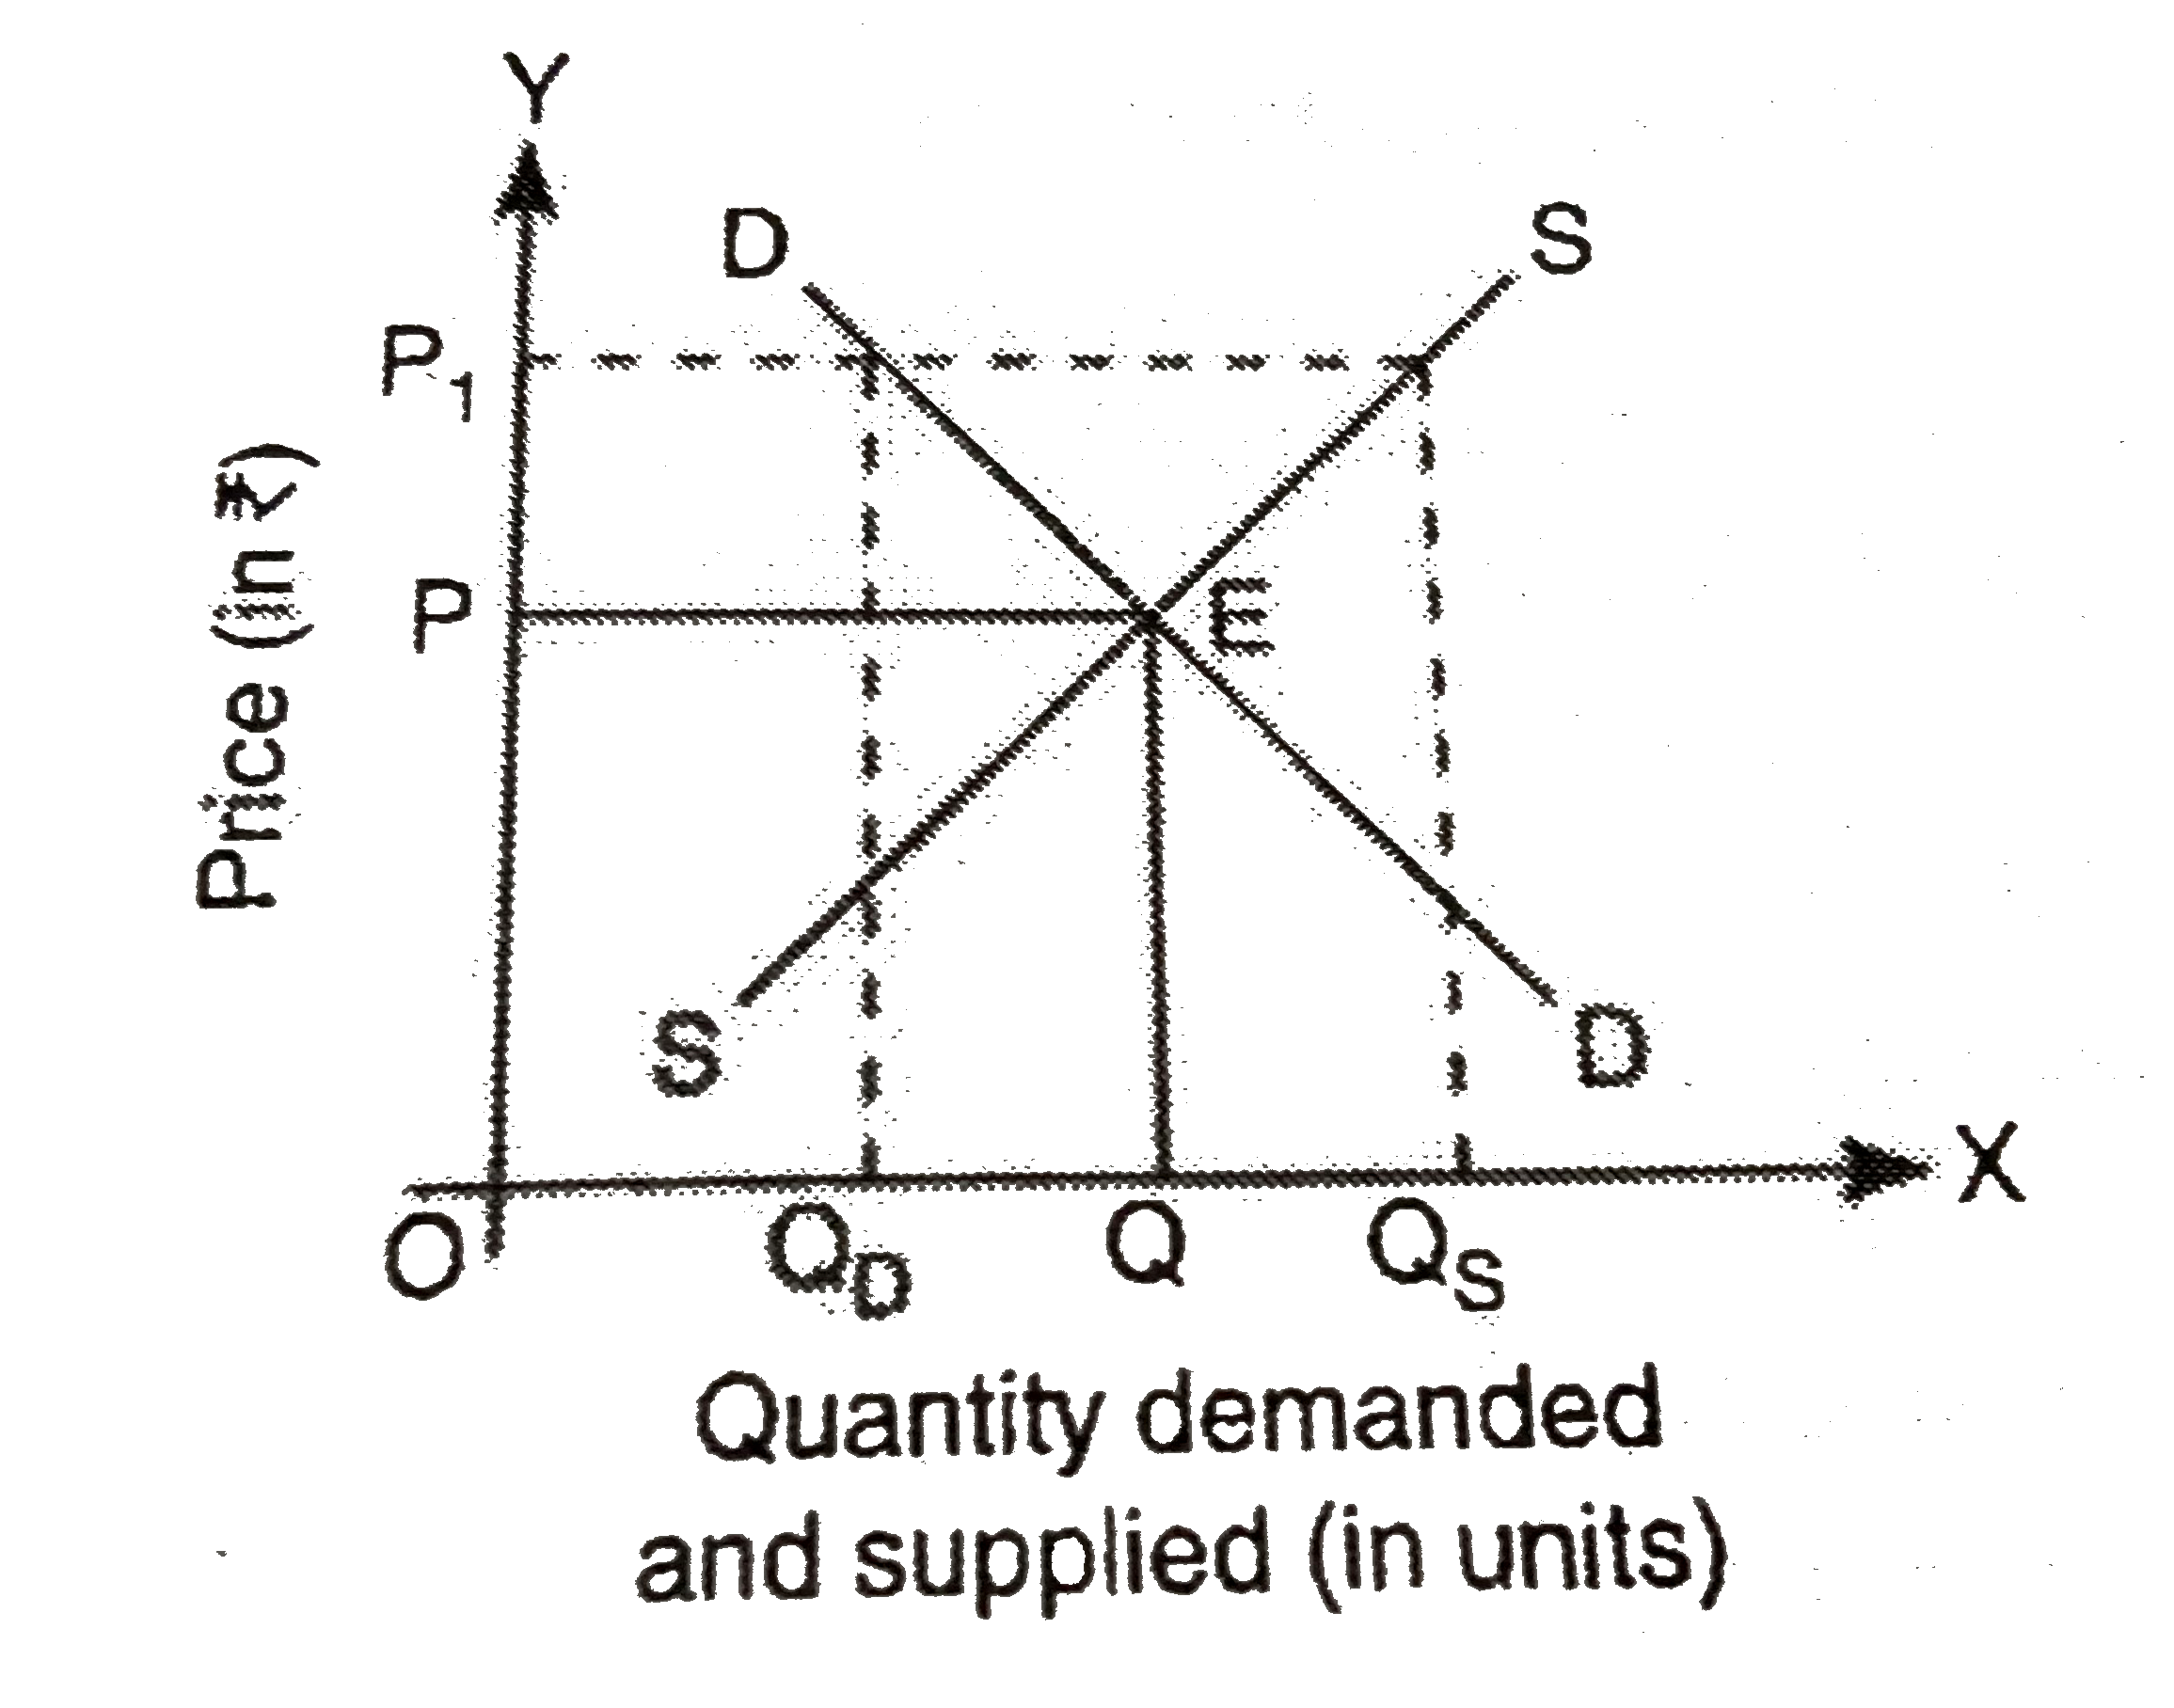 AExcess SupplyBExcess DemandCEquilibrium ConditionDNone of these
The following diagram represents:

a) Adaptive radiation
b) Divergent evolution
c) Convergent evolution
d) Both (a) and (b)AAdaptive radiationBDivergent evolutionCConvergent ecolutionDBoth (a) and (b)
Use the following diagram to answer questions (a), (b), and (c).
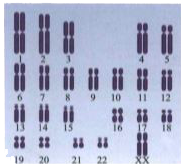
This type of diagram is called
View SolutionLabel the following diagram
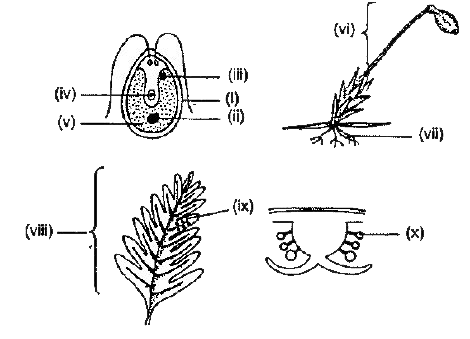
View SolutionConsider the following diagram :
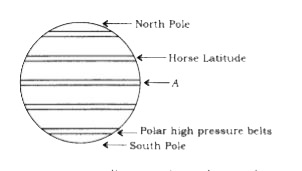
In the diagram given above, what does A denote?
View SolutionThe following diagram represents the situation of:
View SolutionConsider the following diagram :
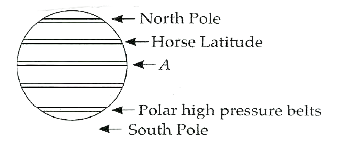
In the diagram given above, what does A denote?
View Solution

