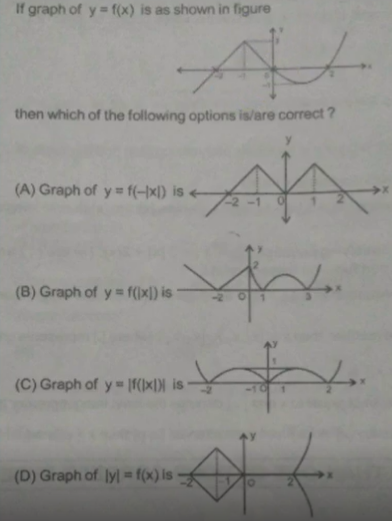
If graph of y= f(x) is as shown in figure, then which of the following options is/are correct?
Step by step video & image solution for If graph of y= f(x) is as shown in figure, then which of the following options is/are correct? by Maths experts to help you in doubts & scoring excellent marks in Class 12 exams.
Updated on:21/07/2023Topper's Solved these Questions
Similar Questions
Knowledge Check
The graph of y=f(x) is shown to the right. If f(−1)=v, then which one of the following could be the value of f(v) ?
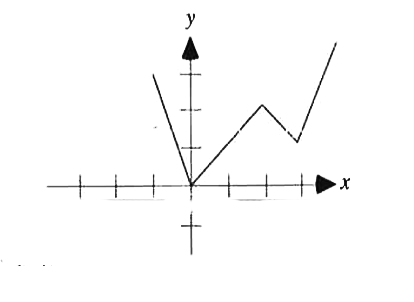 A0B1C2D2.5
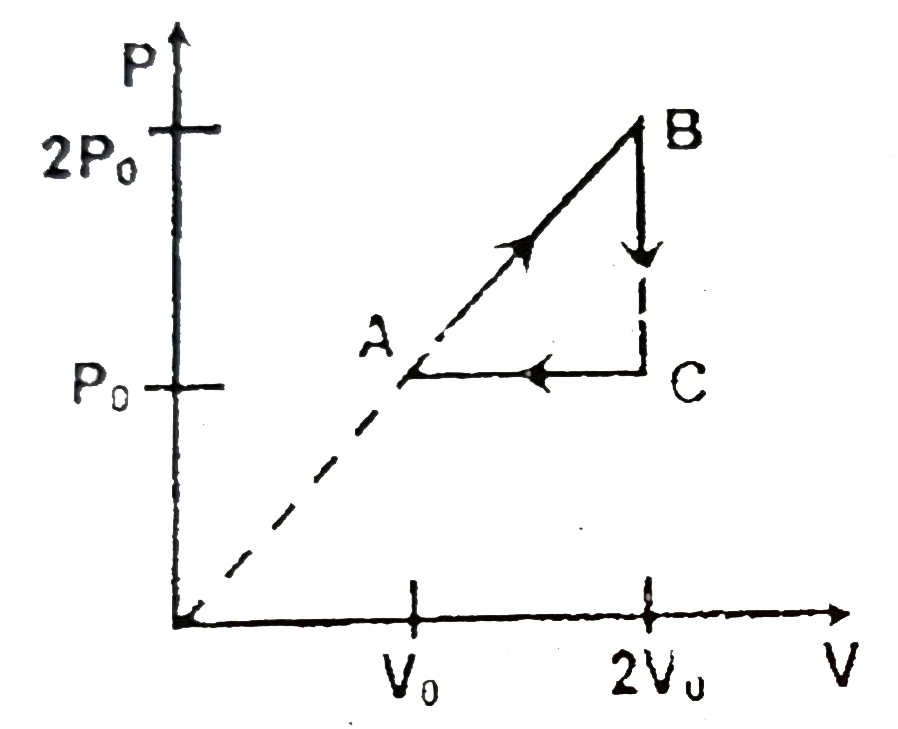
In the process shown below, which of the following option is correct ?
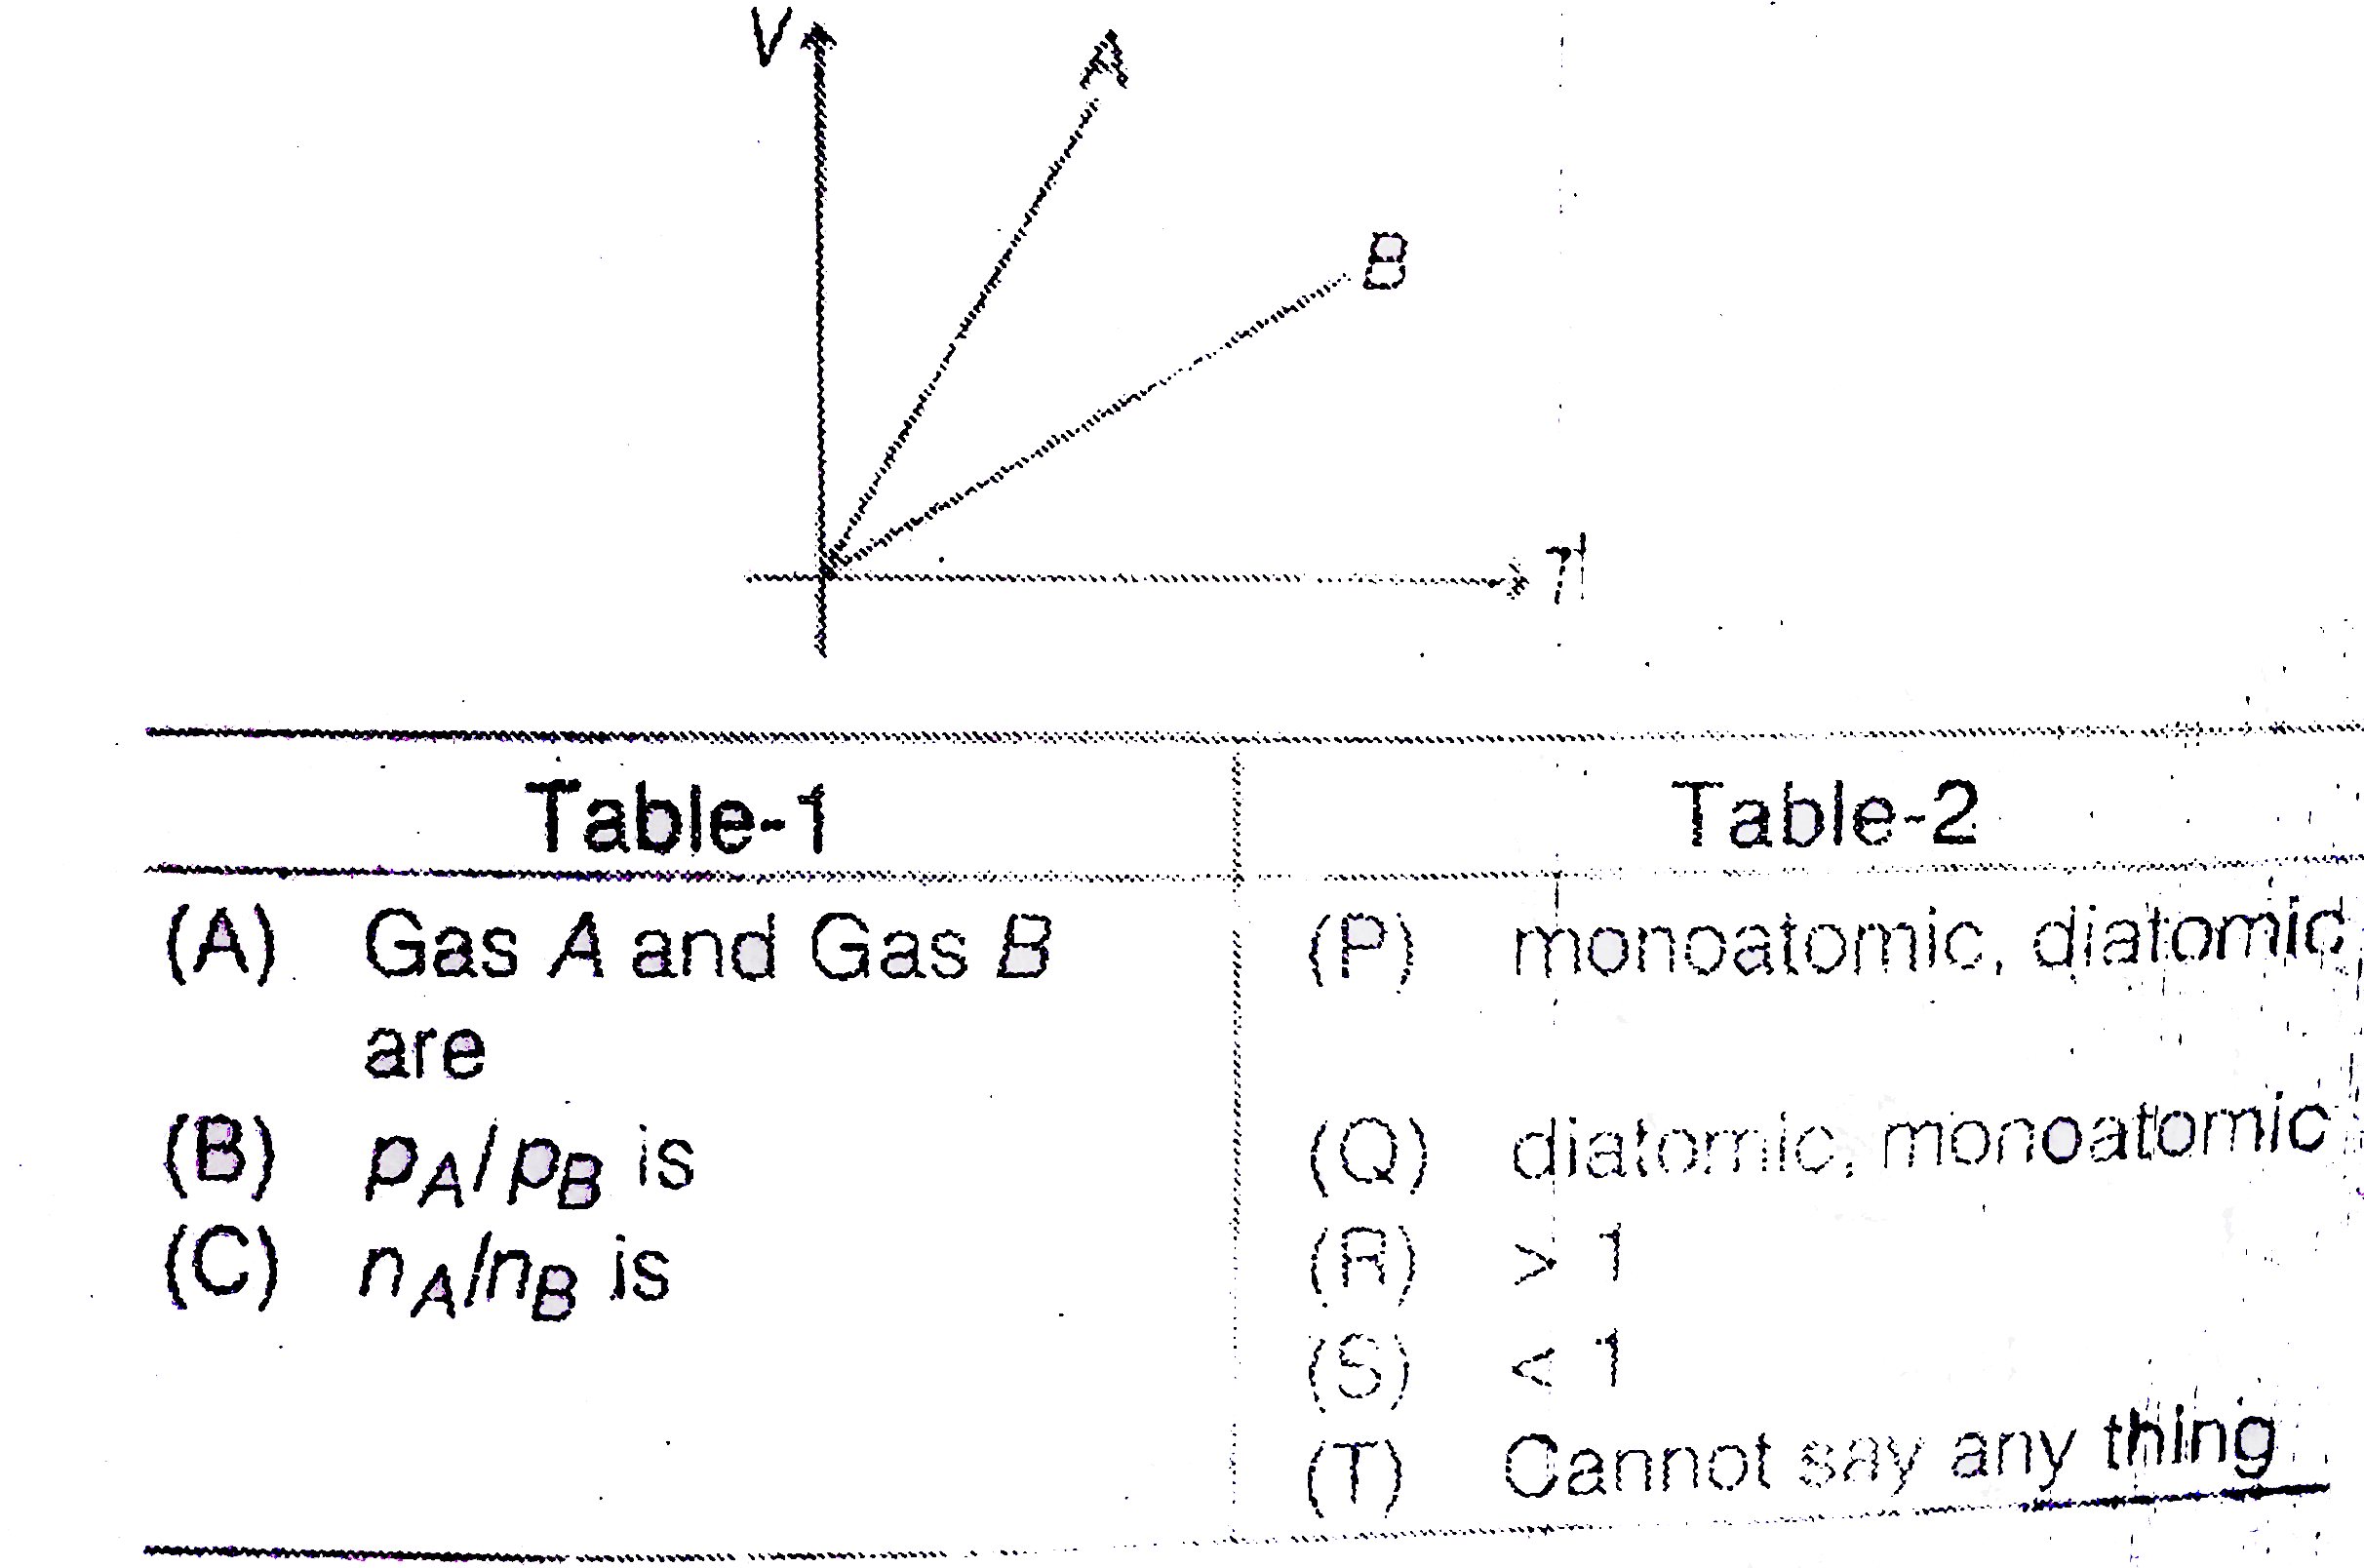
View SolutionIn the V-T graph shown in figure match the following.
View SolutionIf the graph of y=|f(x)| is as shown in figure
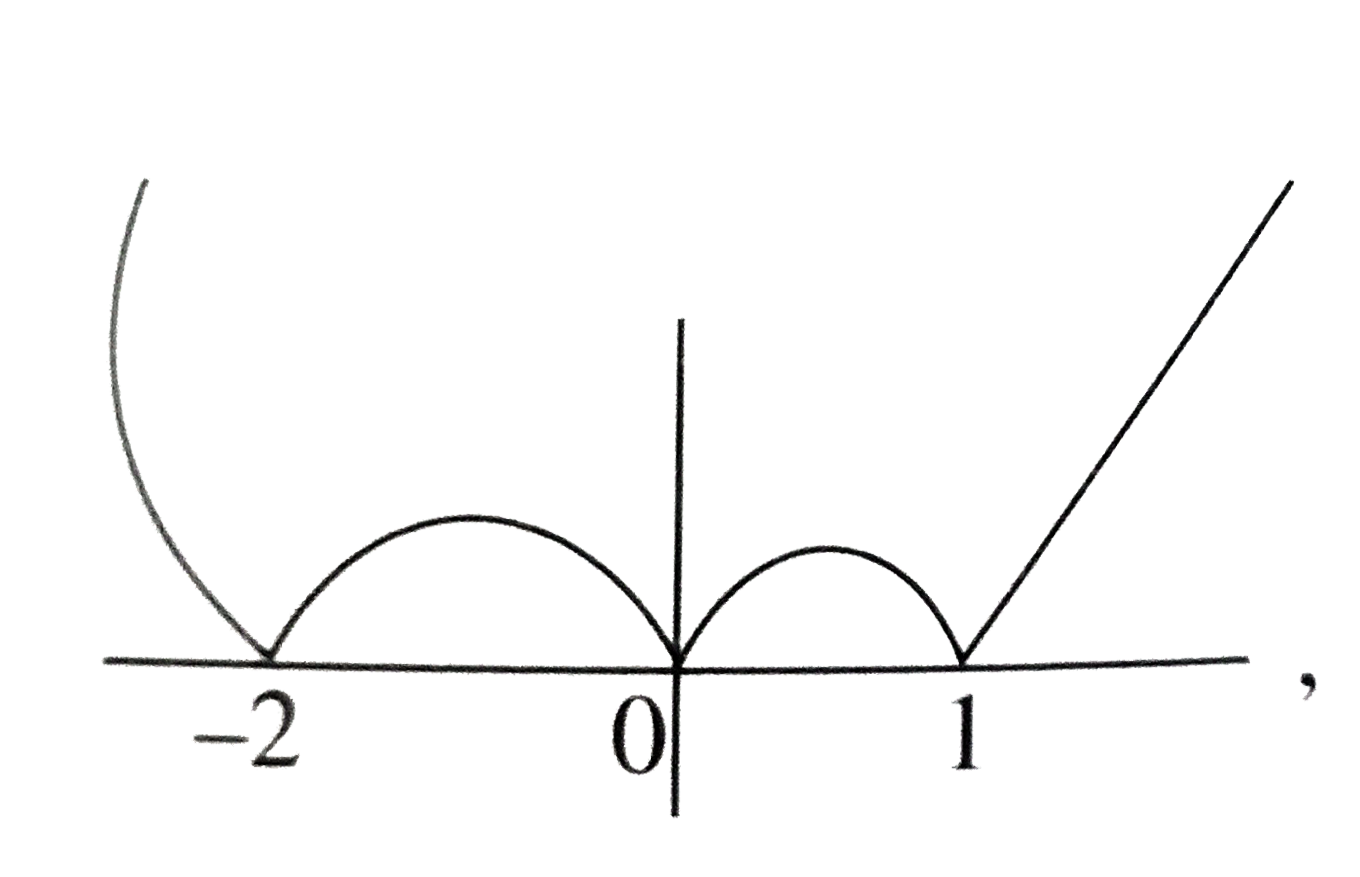 then the graph of y=f(x) may be
View SolutionGraph of y=f(x) is as shown in the following figure.
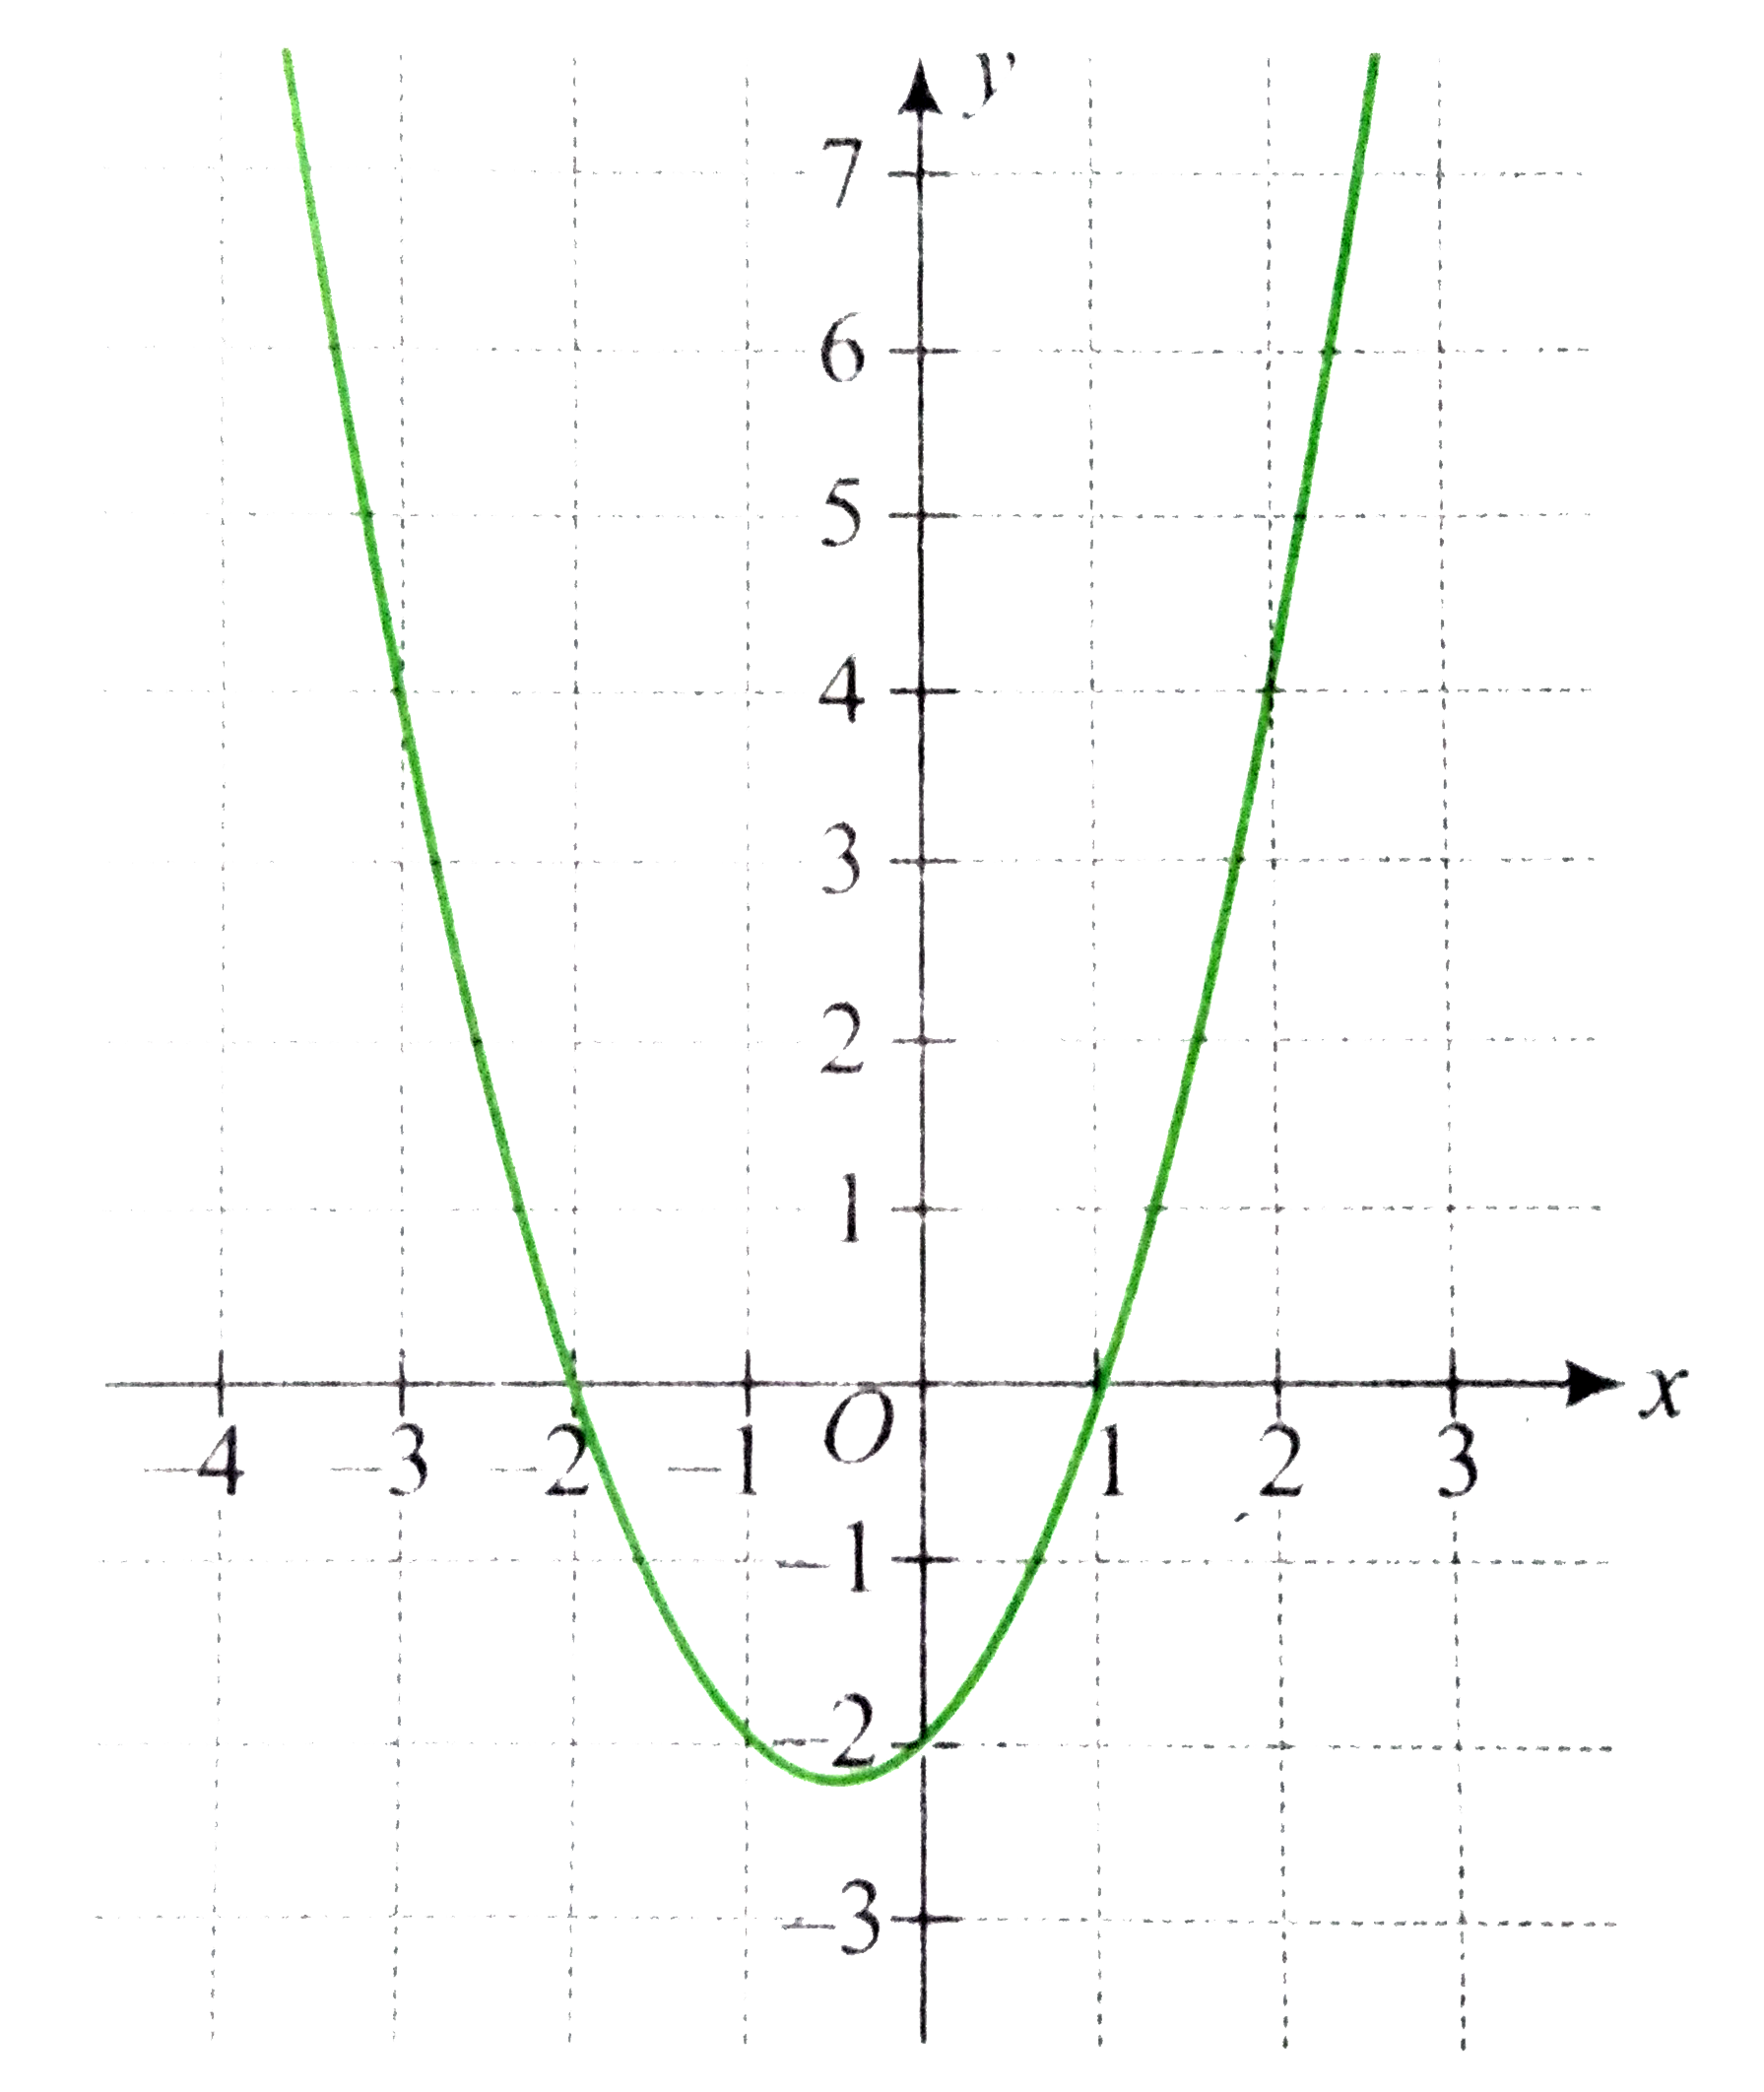
Find the roots of the following equations
f(x)=0
f(x)=4
f(x)=x+2
View SolutionThe displacement-time graph for a particle executing SHM is as shown in figure. Which of the following statements is correct?
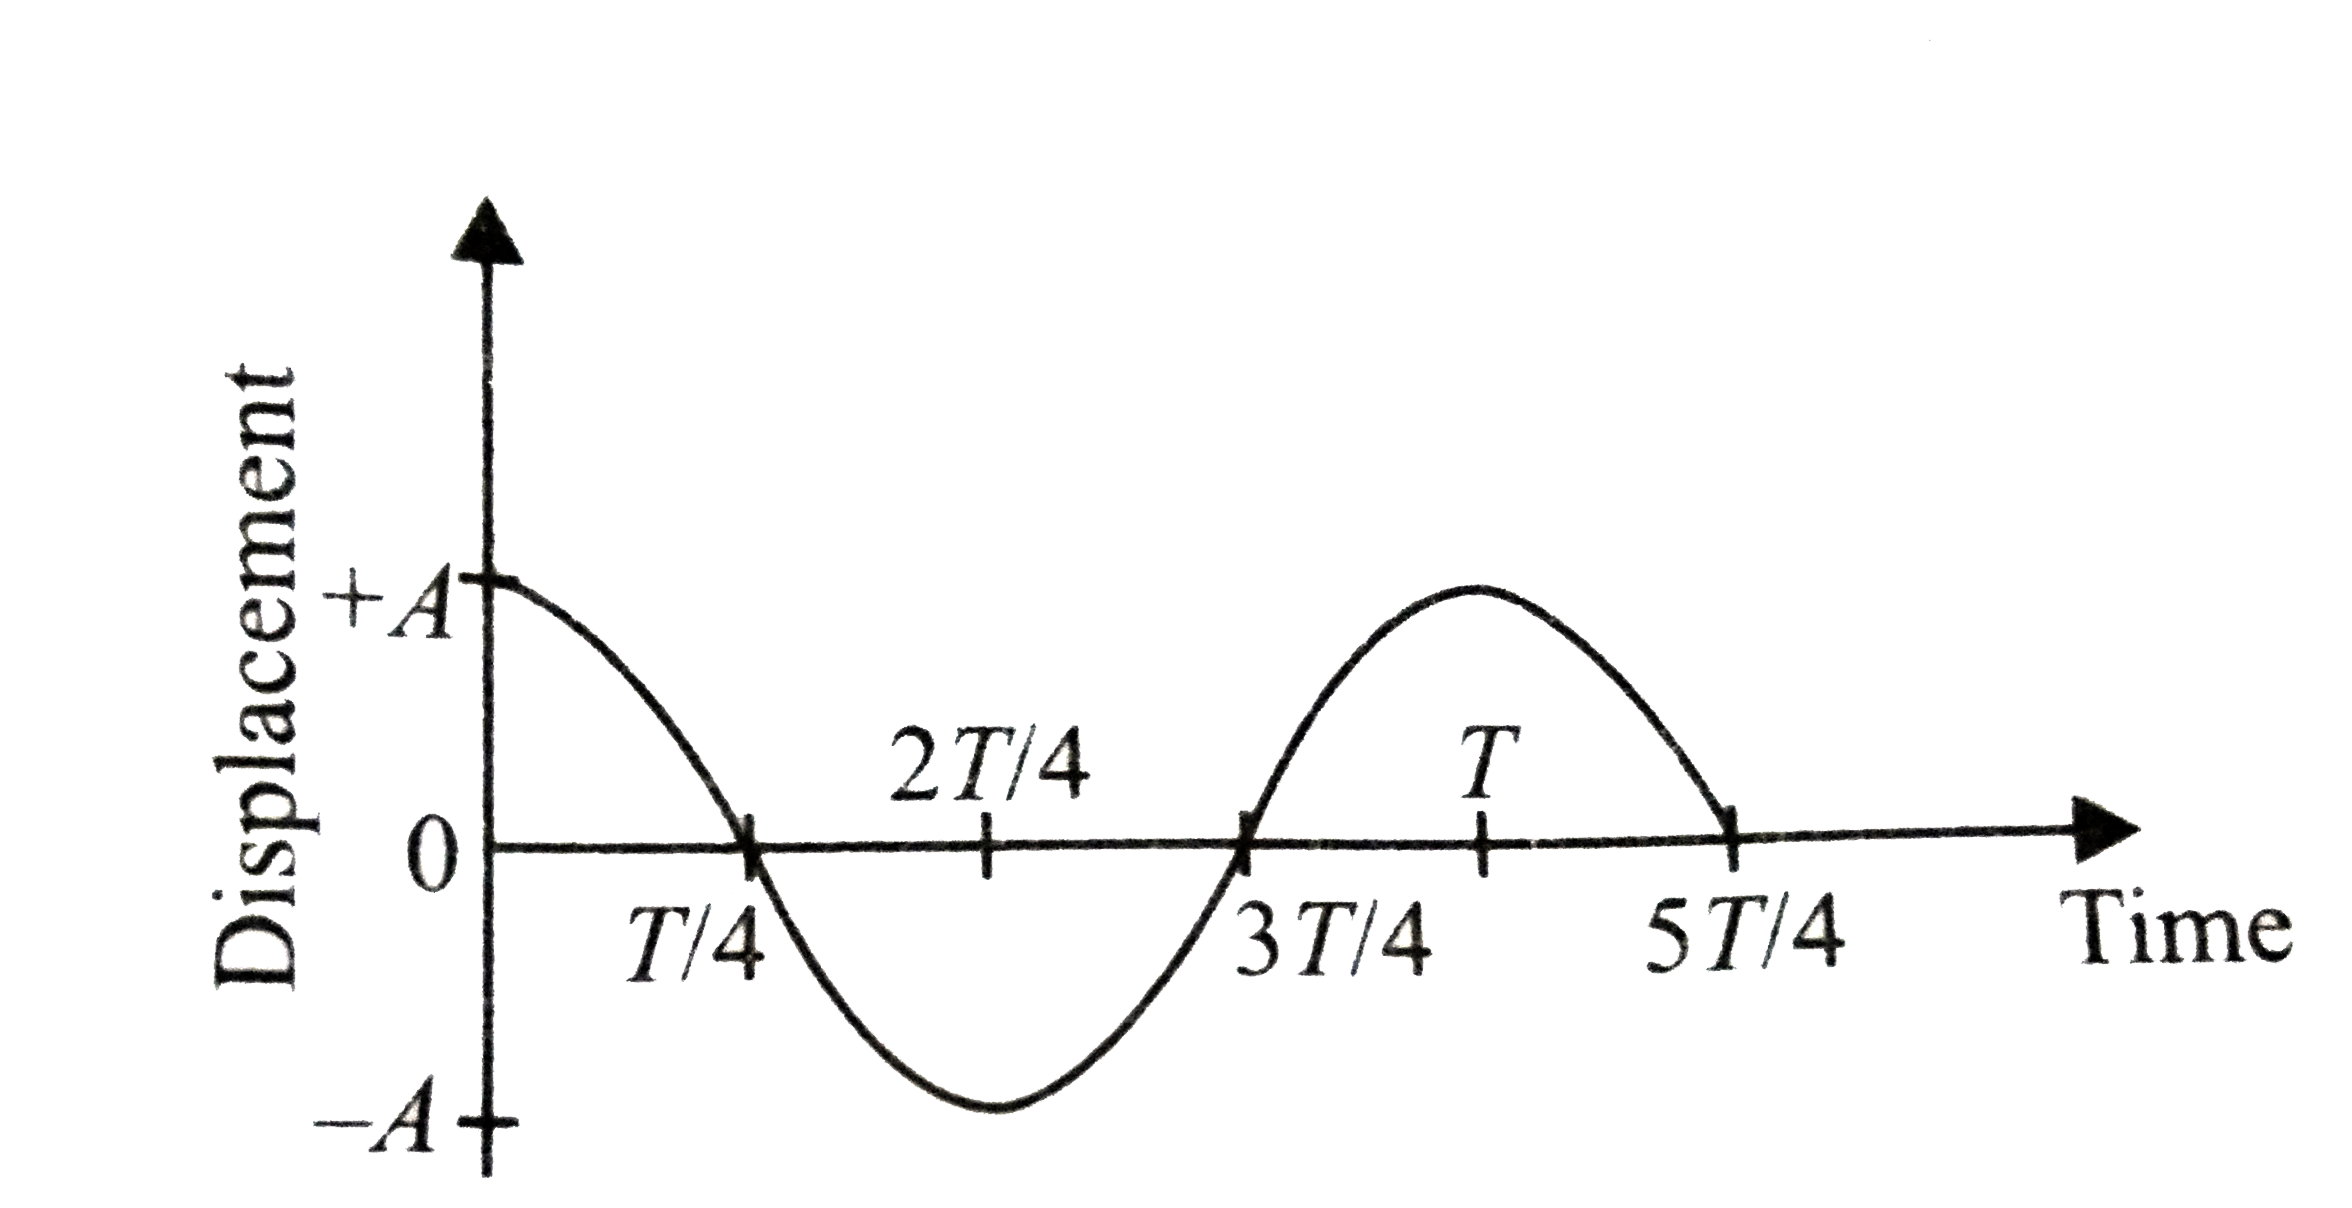
View SolutionIn the ρ-T graph shown in figure, match the following.
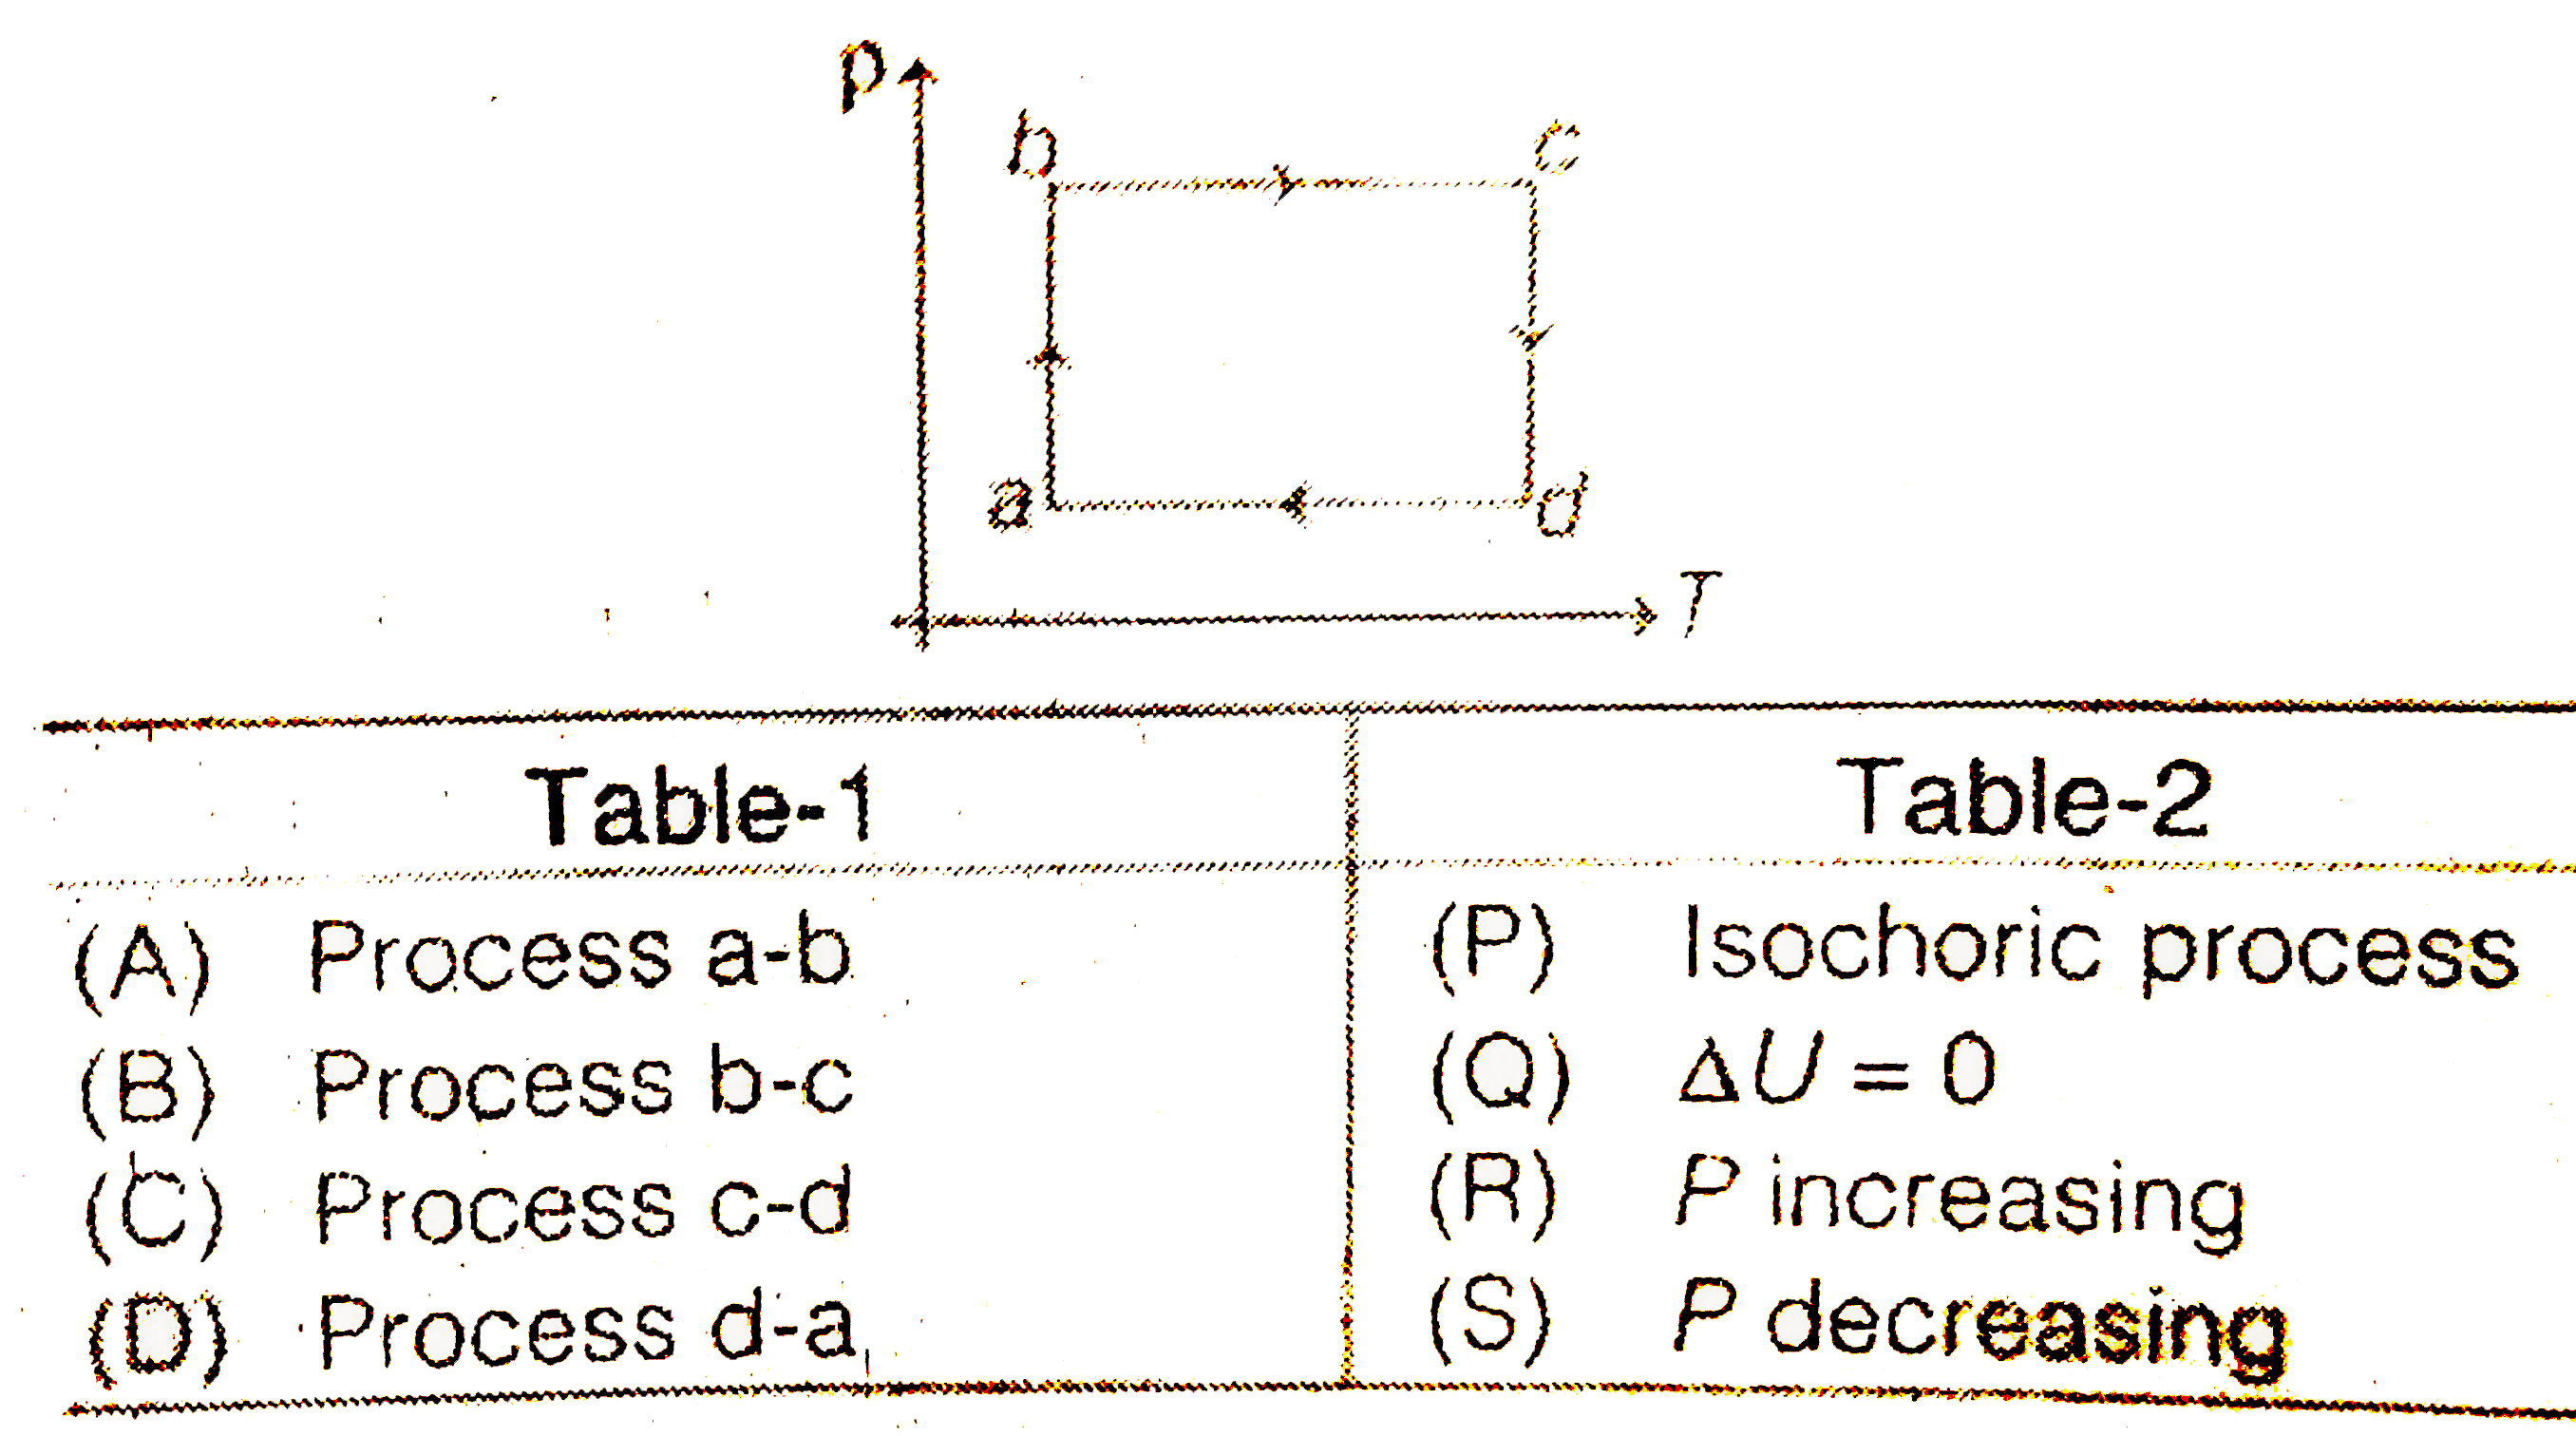
View Solution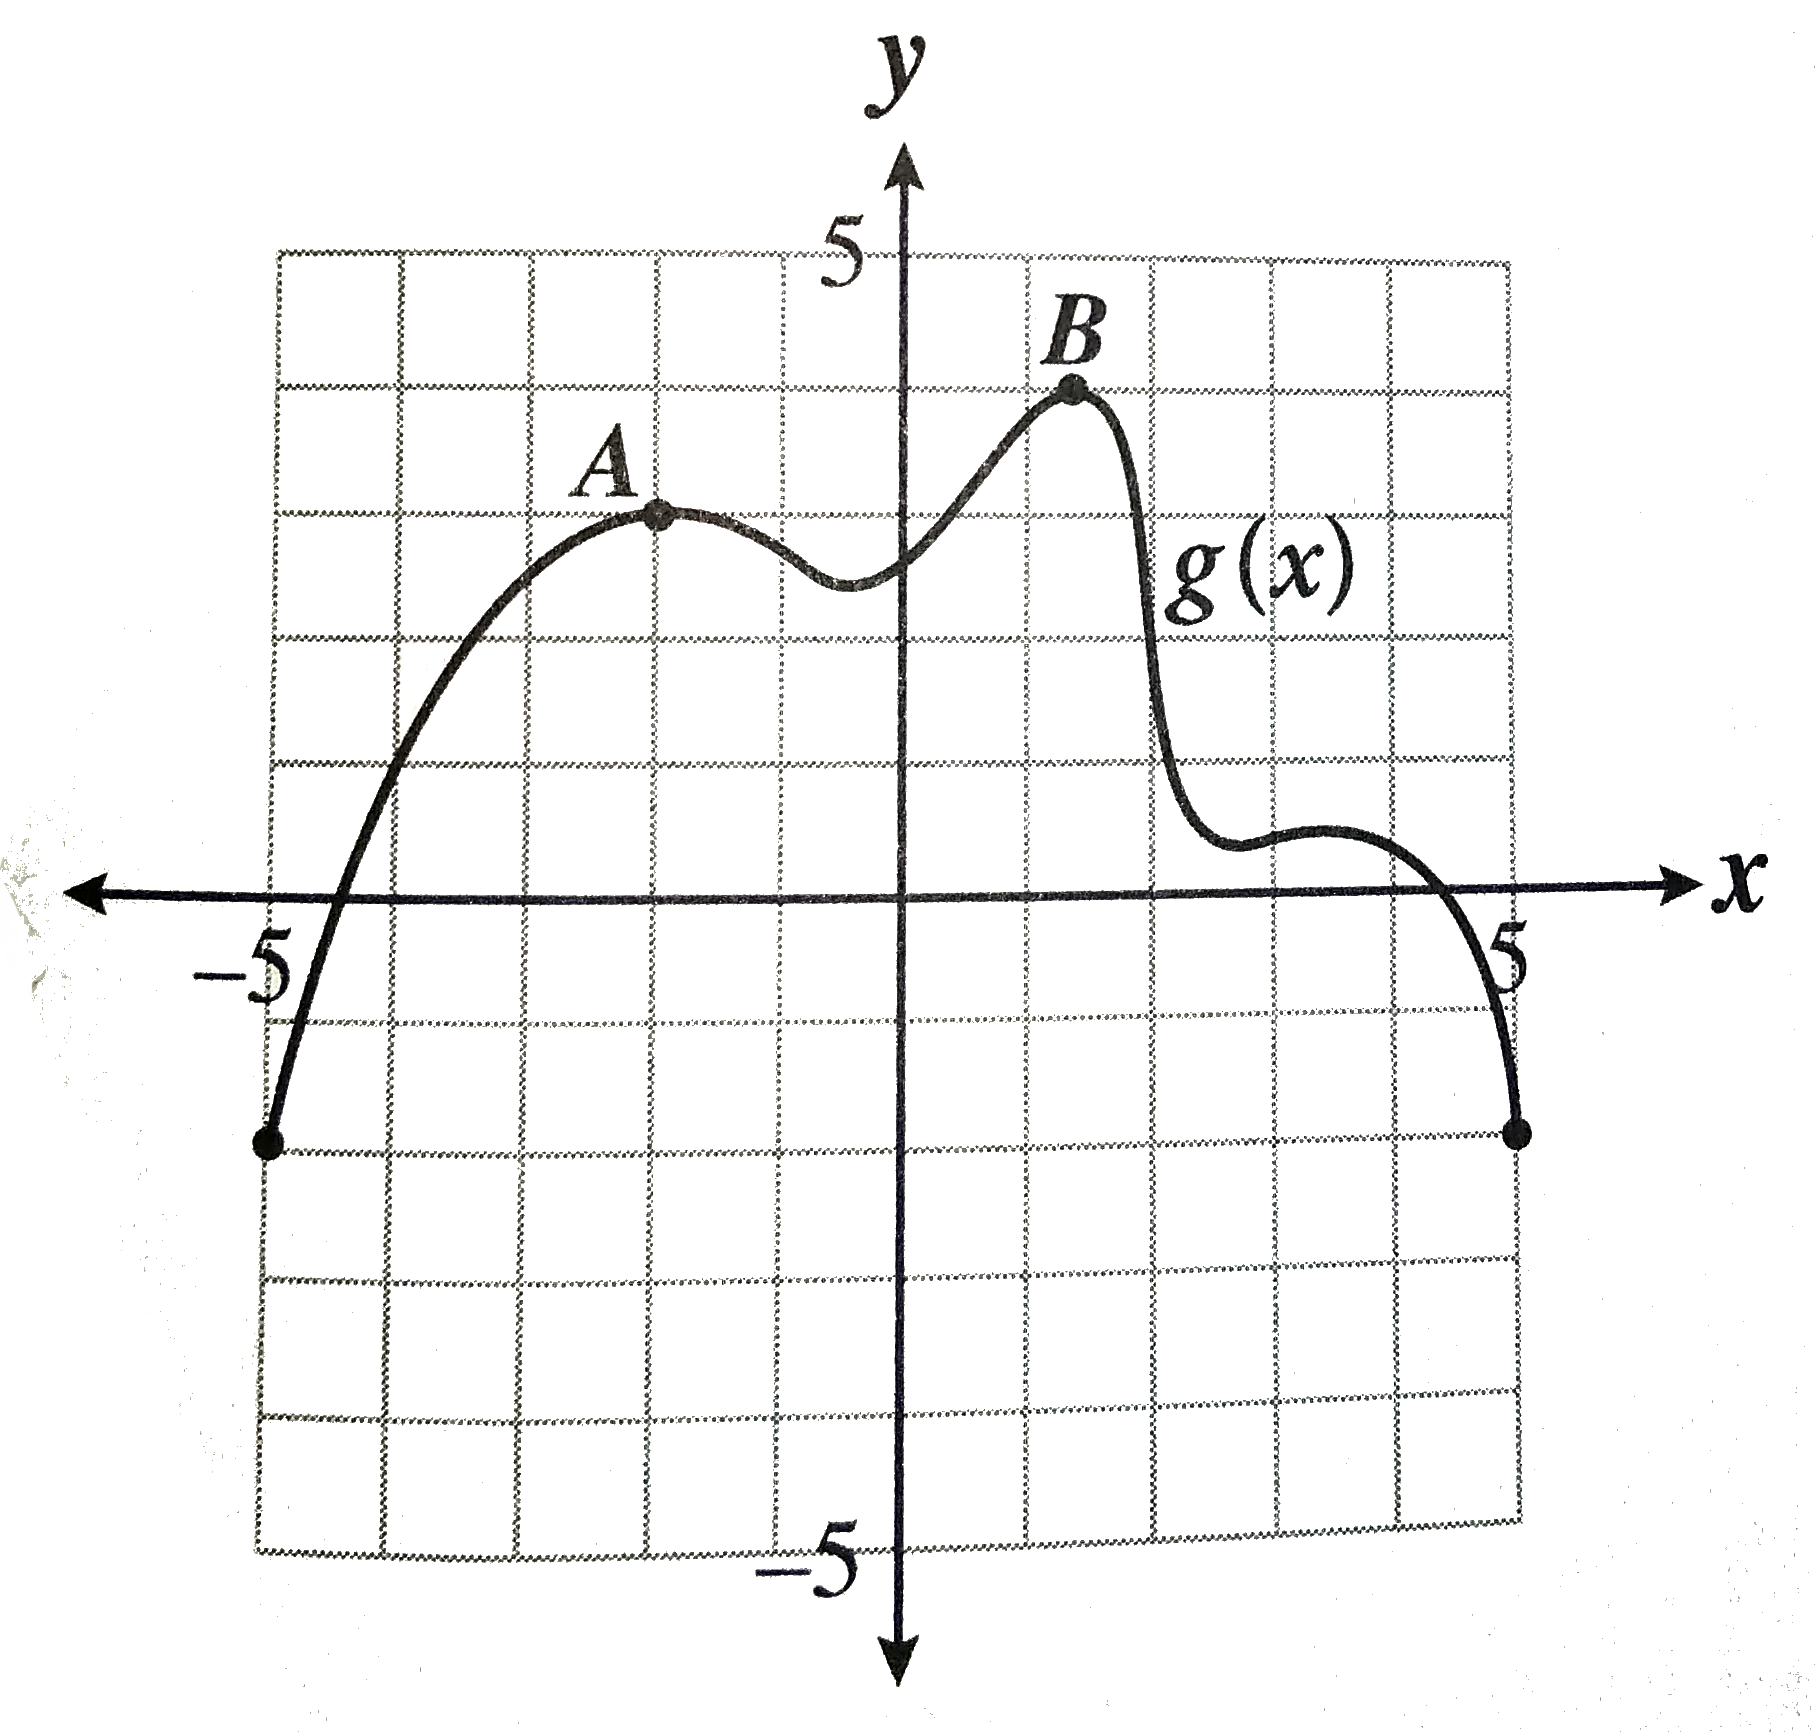
The graph of g(x) is shown in the figure above. If h(x)=−g(x)+1, which of the following statements is true?
View Solution

