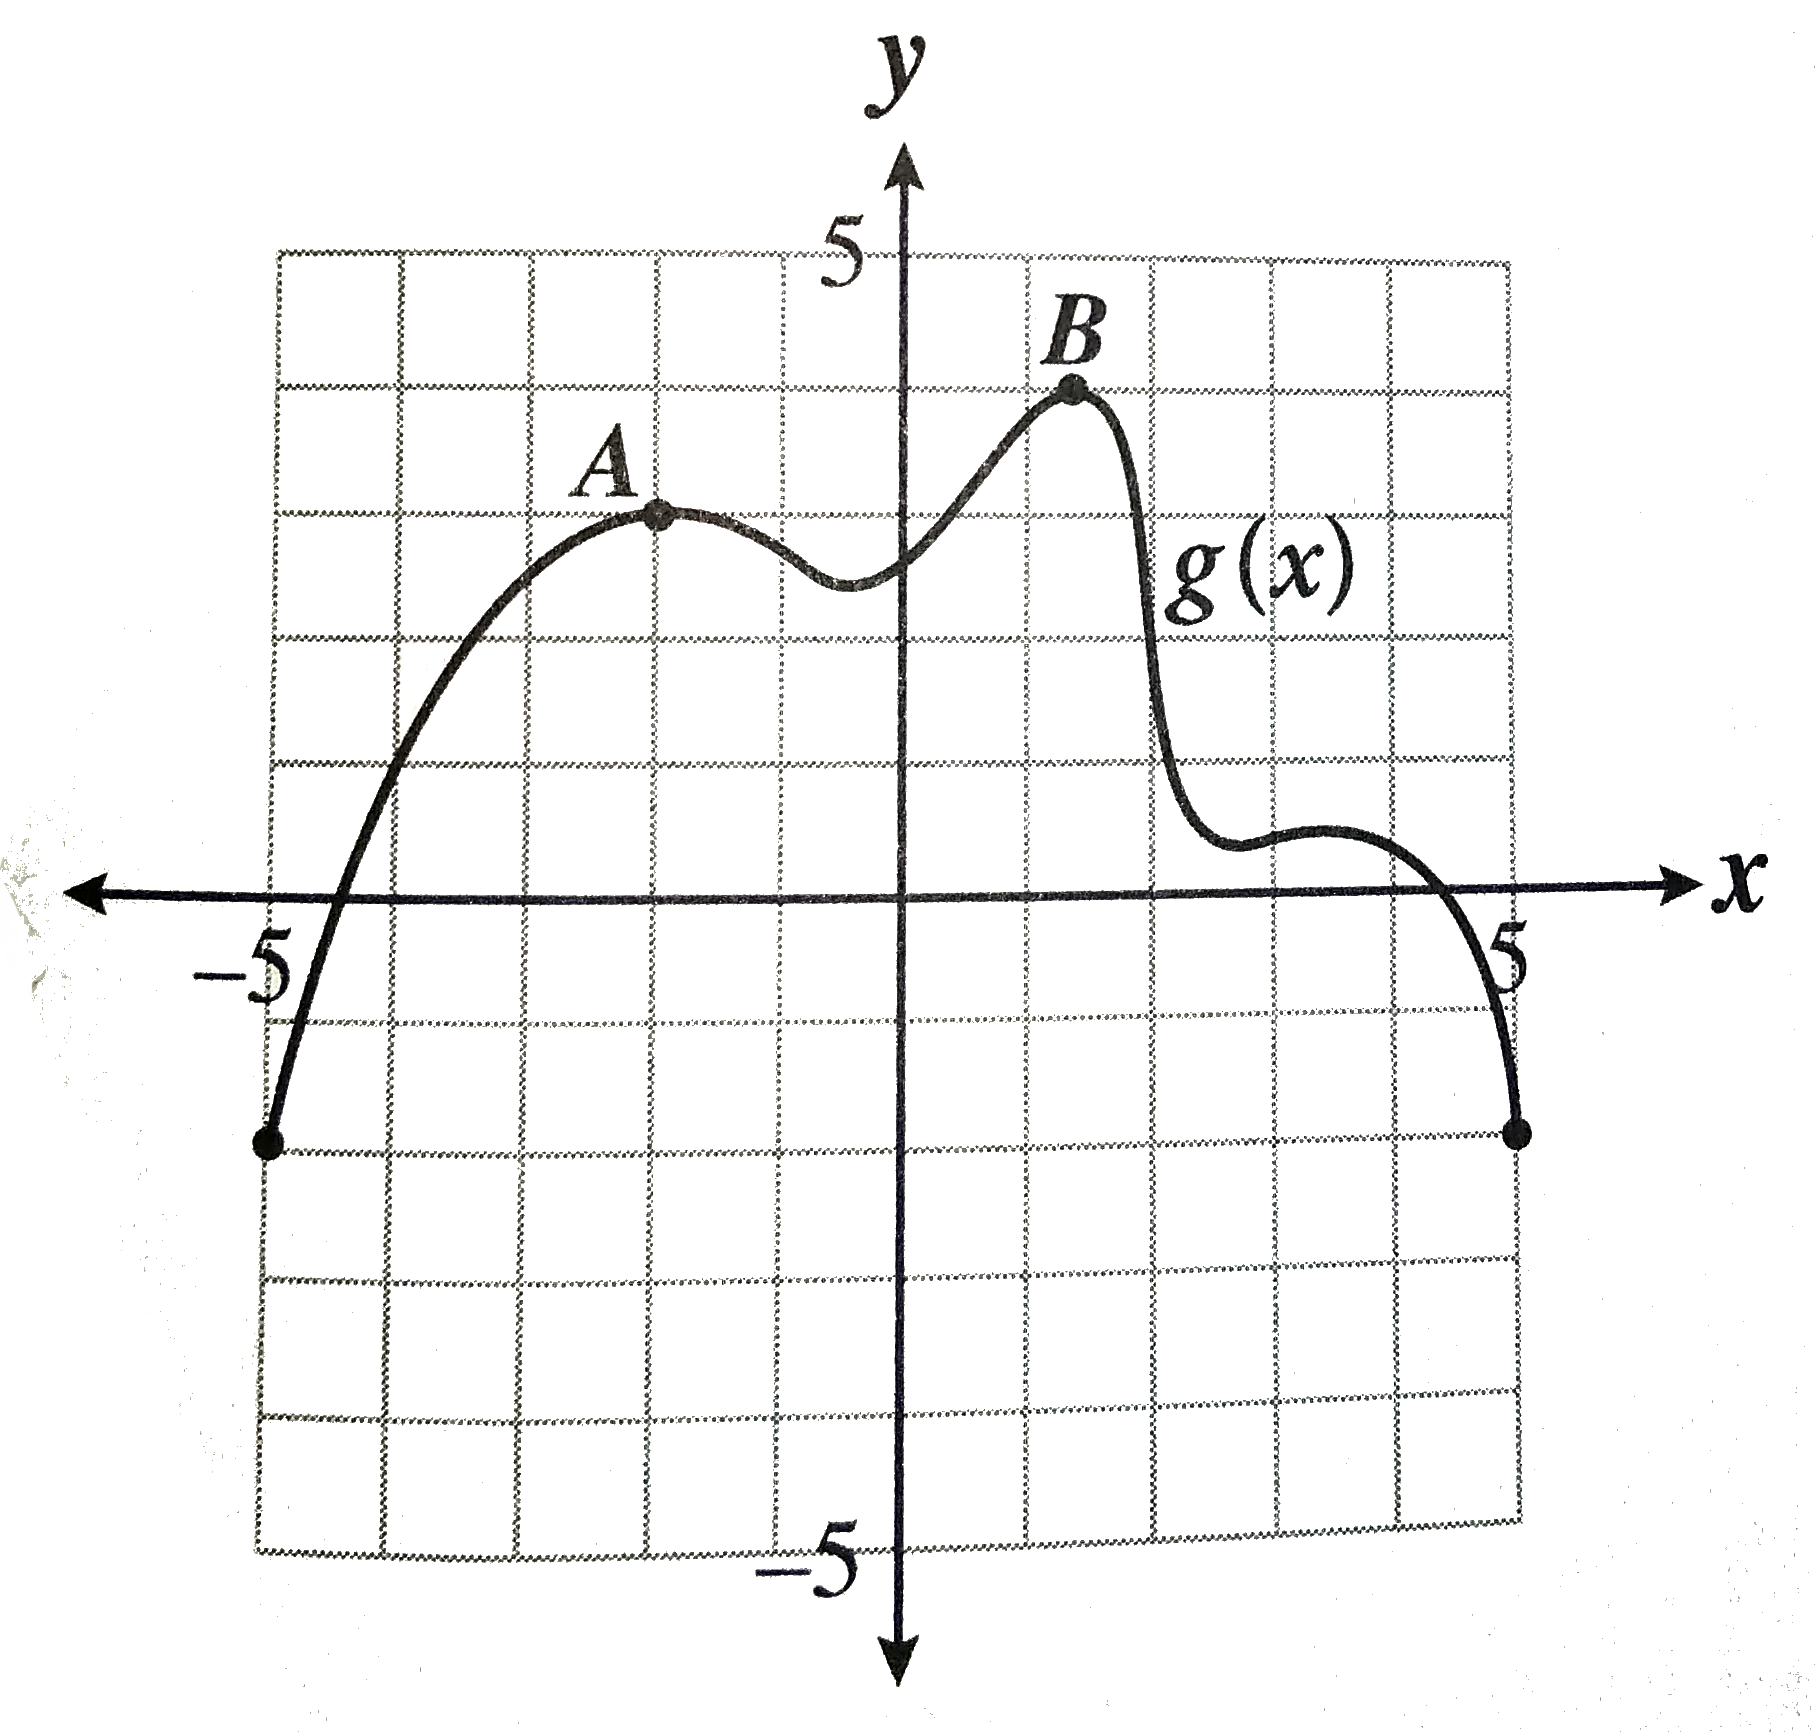
The graph of g(x) is shown in the figure above. If h(x)=−g(x)+1, which of the following statements is true?
The range of h(x) is −3≤y≤3
The minimum value of h(x) is 4.
The coordinates of the point A on the function h(x) is (2, 4).
The graph of h(x) is increasing between x=−5andx=−2
The correct Answer is:A
Step by step video & image solution for The graph of g(x) is shown in the figure above. If h(x)=-g(x)+1, which of the following statements is true? by Maths experts to help you in doubts & scoring excellent marks in Class 10 exams.
Updated on:21/07/2023Topper's Solved these Questions
Similar Questions
Knowledge Check
If g(x)=(x−2)2−5, which of the following statements is true ?
AThe function g (x) is increasing over the entire domain.BThe functin g (x) is decreasing over the entire domain.CThe function g (x) is increasing for x<2 and decreasing for x>2.DThe function g (x) is decreasing for x<2 and increasing for x>2.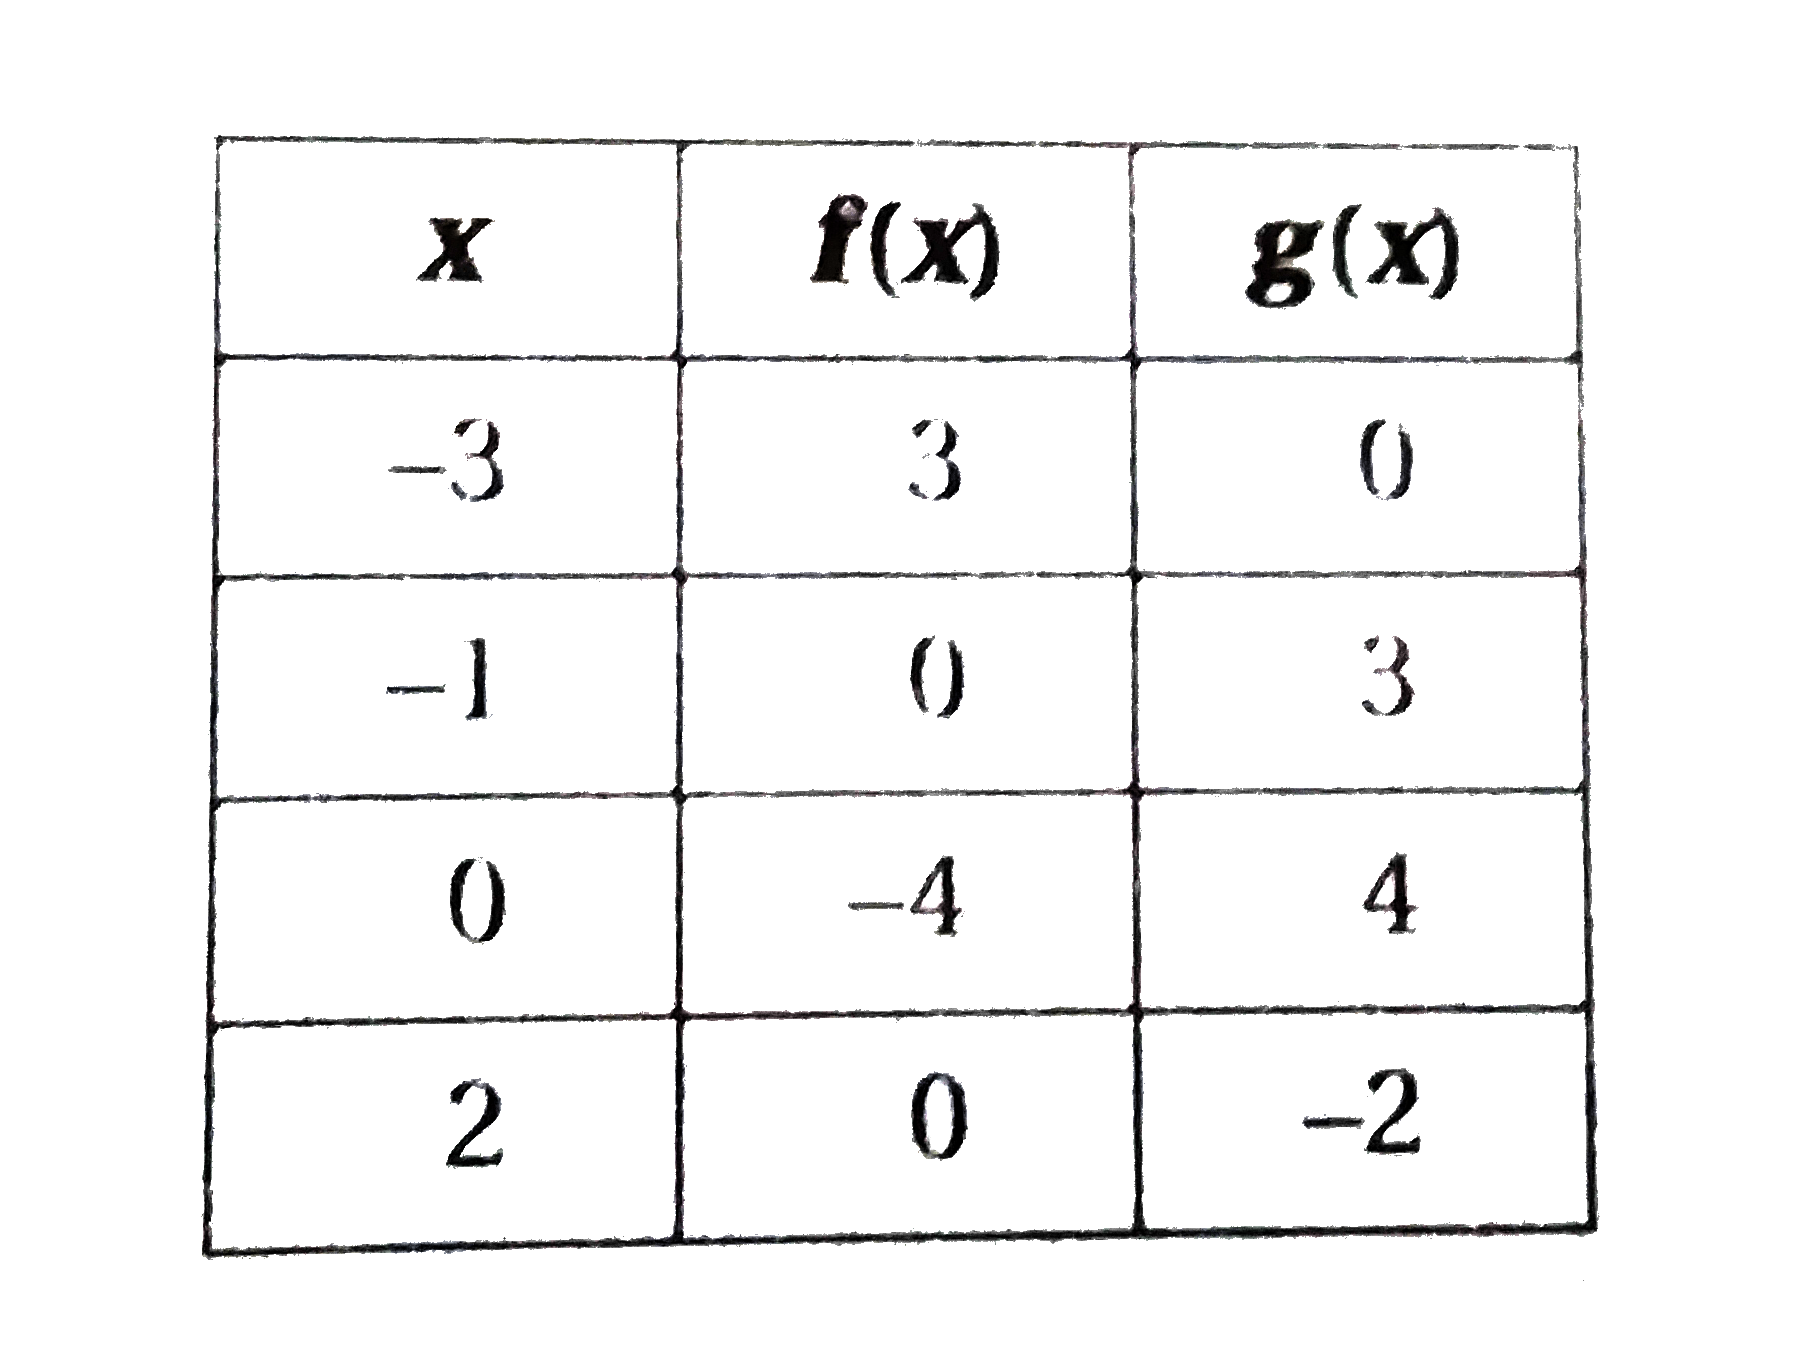
Several values of x, and the corresponding values for polynomial functions f and g are shown in the table above. Which of the following statements is true?
I. f(0)+g(0)=0
II. f(x) is divisible by x+2
III. g(x) is divisible by x+3.AI, II, and IIIBI and II, onlyCII and III, onlyDI and III, only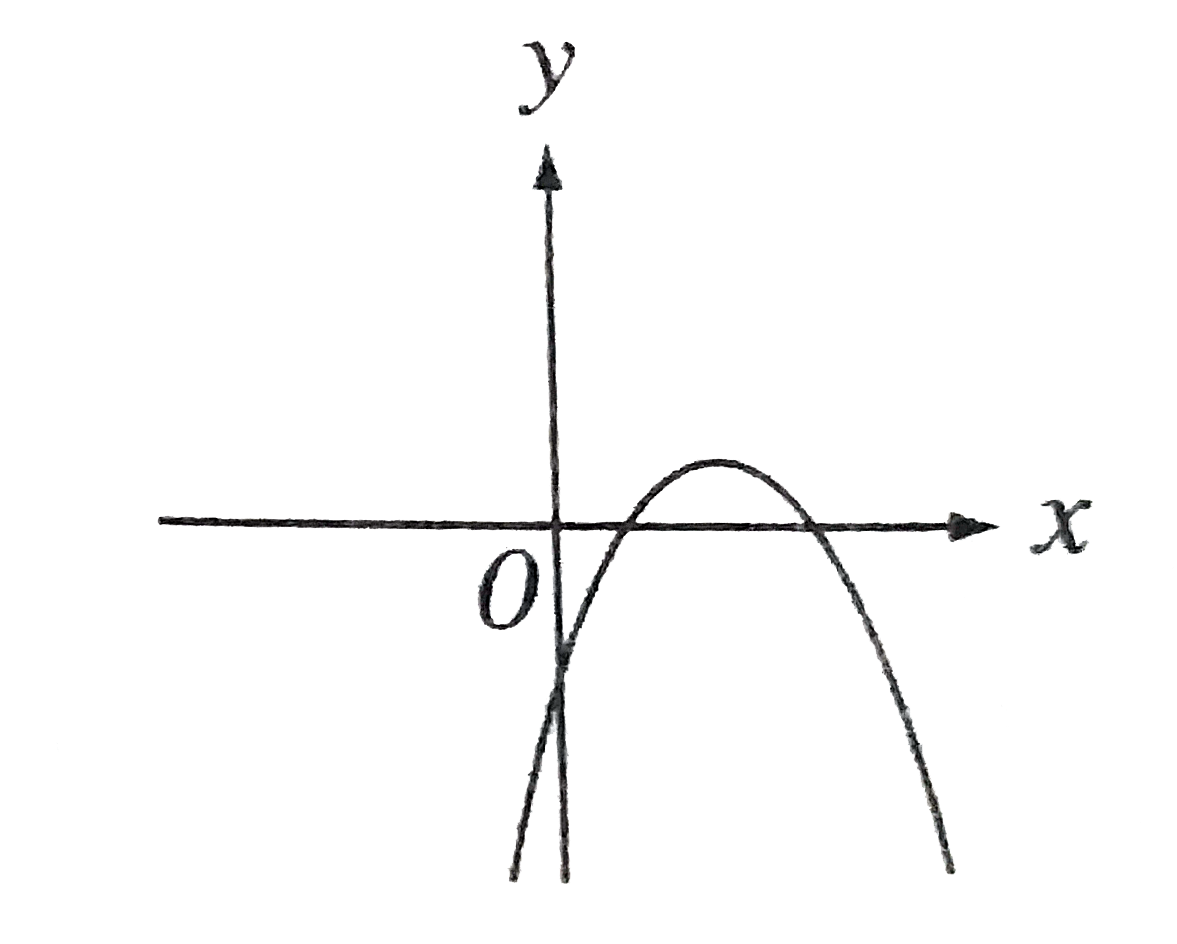
The graph of y=g(x) is shown in the figure above. If g(x)=ax2+bx+c for constants a,b and c and if abc≠0, then which of the following must be true?Aac>1Bc>1Cac>0Da>0
Let f(x)=sin−1xandg(x)=cos−1x, then which of the following statements are correct?
View SolutionThe graph of y =g(x) =f(X) is as shown in the following figure analyse this graph and answer the following question
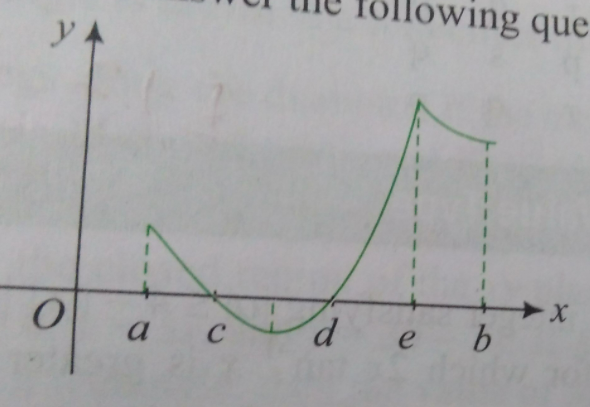
Number of points of inflectionn the graph of y = f(x) for a<x<b has
View SolutionIf g(x+3)=x2+2x+1, then which of the following gives g(x)?
View Solution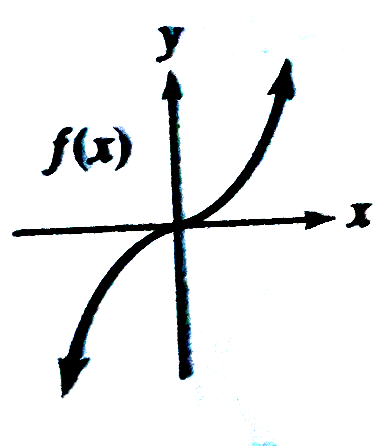
The graph of f(x) is shown above , Which of the following represents the graph of f(x-3) ?
View Solution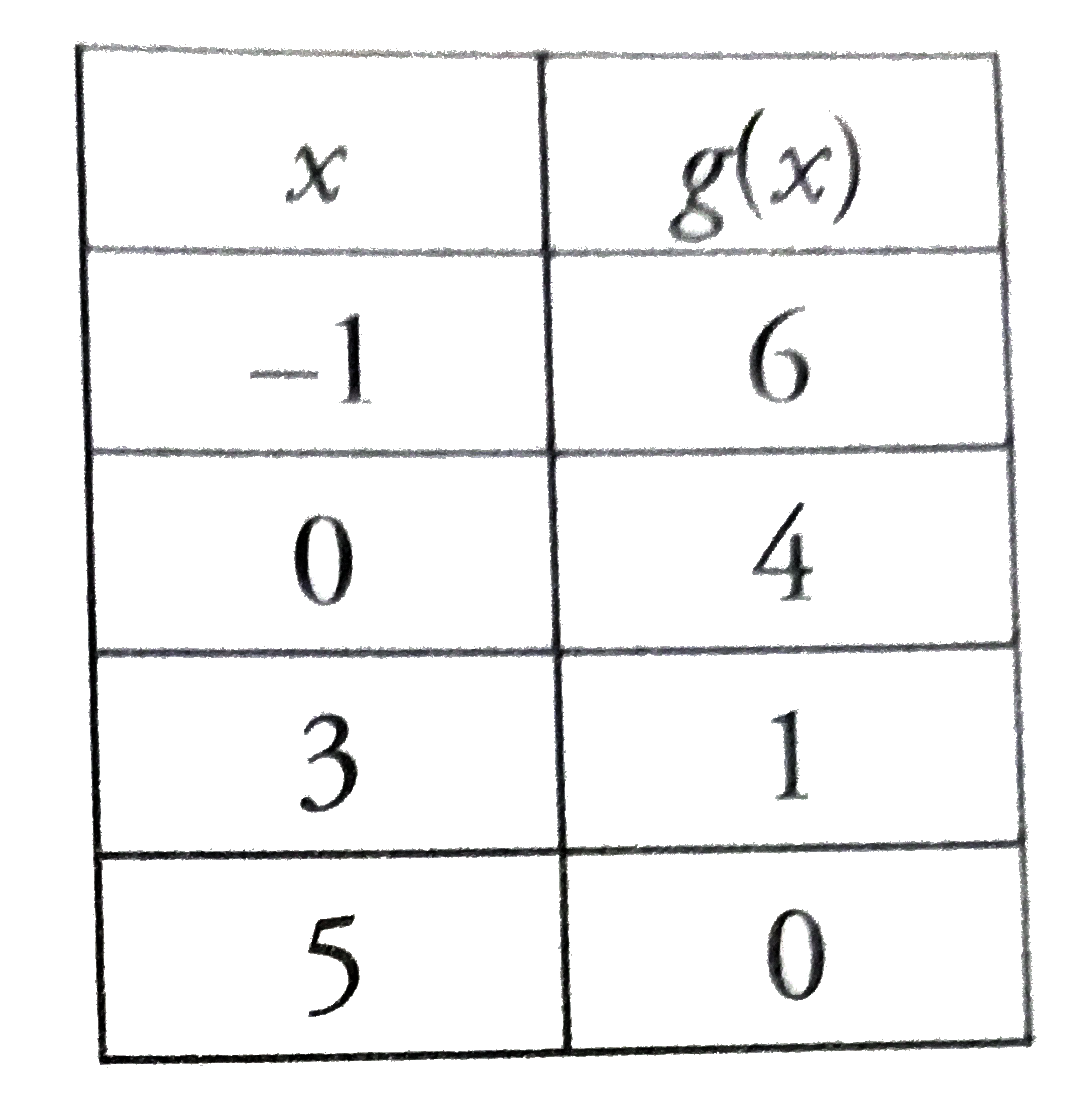
The function g is defined by a polynomial some of the value of x and g(x) are shown in the table above. Which of the following must be factor of g?
View Solution

