Plot the points in a rectangular coordinate system: (−4,2)
To plot the point (-4, 2) in a rectangular coordinate system, follow these steps:
1. Draw the Coordinate Axes:
- Begin by drawing two perpendicular lines that intersect at a point called the origin (0, 0).
- The horizontal line represents the x-axis, and the vertical line represents the y-axis.
2. Label the Axes:
- Mark the positive and negative directions on both axes.
- On the x-axis, to the right of the origin is positive (1, 2, 3, ...) and to the left is negative (-1, -2, -3, ...).
- On the y-axis, above the origin is positive (1, 2, 3, ...) and below the origin is negative (-1, -2, -3, ...).
3. Locate the x-coordinate:
- The x-coordinate of the point (-4, 2) is -4.
- From the origin, move 4 units to the left along the x-axis. This point is marked as (-4, 0).
4. Locate the y-coordinate:
- The y-coordinate of the point (-4, 2) is 2.
- From the point (-4, 0) that you just marked, move vertically upwards 2 units.
5. Plot the Point:
- The point where you end up after moving 2 units up from (-4, 0) is the point (-4, 2).
- Mark this point clearly on the graph.
6. Label the Point:
- It is helpful to label the point as (-4, 2) for clarity.
Final Result:
You have successfully plotted the point (-4, 2) on the rectangular coordinate system.
---
- Begin by drawing two perpendicular lines that intersect at a point called the origin (0, 0).
- The horizontal line represents the x-axis, and the vertical line represents the y-axis.
- Mark the positive and negative directions on both axes.
- On the x-axis, to the right of the origin is positive (1, 2, 3, ...) and to the left is negative (-1, -2, -3, ...).
- On the y-axis, above the origin is positive (1, 2, 3, ...) and below the origin is negative (-1, -2, -3, ...).
- The x-coordinate of the point (-4, 2) is -4.
- From the origin, move 4 units to the left along the x-axis. This point is marked as (-4, 0).
- The y-coordinate of the point (-4, 2) is 2.
- From the point (-4, 0) that you just marked, move vertically upwards 2 units.
- The point where you end up after moving 2 units up from (-4, 0) is the point (-4, 2).
- Mark this point clearly on the graph.
- It is helpful to label the point as (-4, 2) for clarity.
You have successfully plotted the point (-4, 2) on the rectangular coordinate system.
Similar Questions
Knowledge Check
The points in the rectangular coordinate plane are transformed in such a way that each point A(x,y) is moved to a point A'(kx,ky). If the distance between a point A and the origin is d, then the distance between the origin and thhe point A' is
AkdBdkCdDkd
Plot the points in a rectangular coordinate system: (−2,7)
View SolutionPlot the points in a rectangular coordinate system: (−2,−7)
View SolutionPlot the points in a rectangular coordinate system: (6,−2)
View SolutionPlot the points (−3,0)
View SolutionPlot the points (−2,−3)
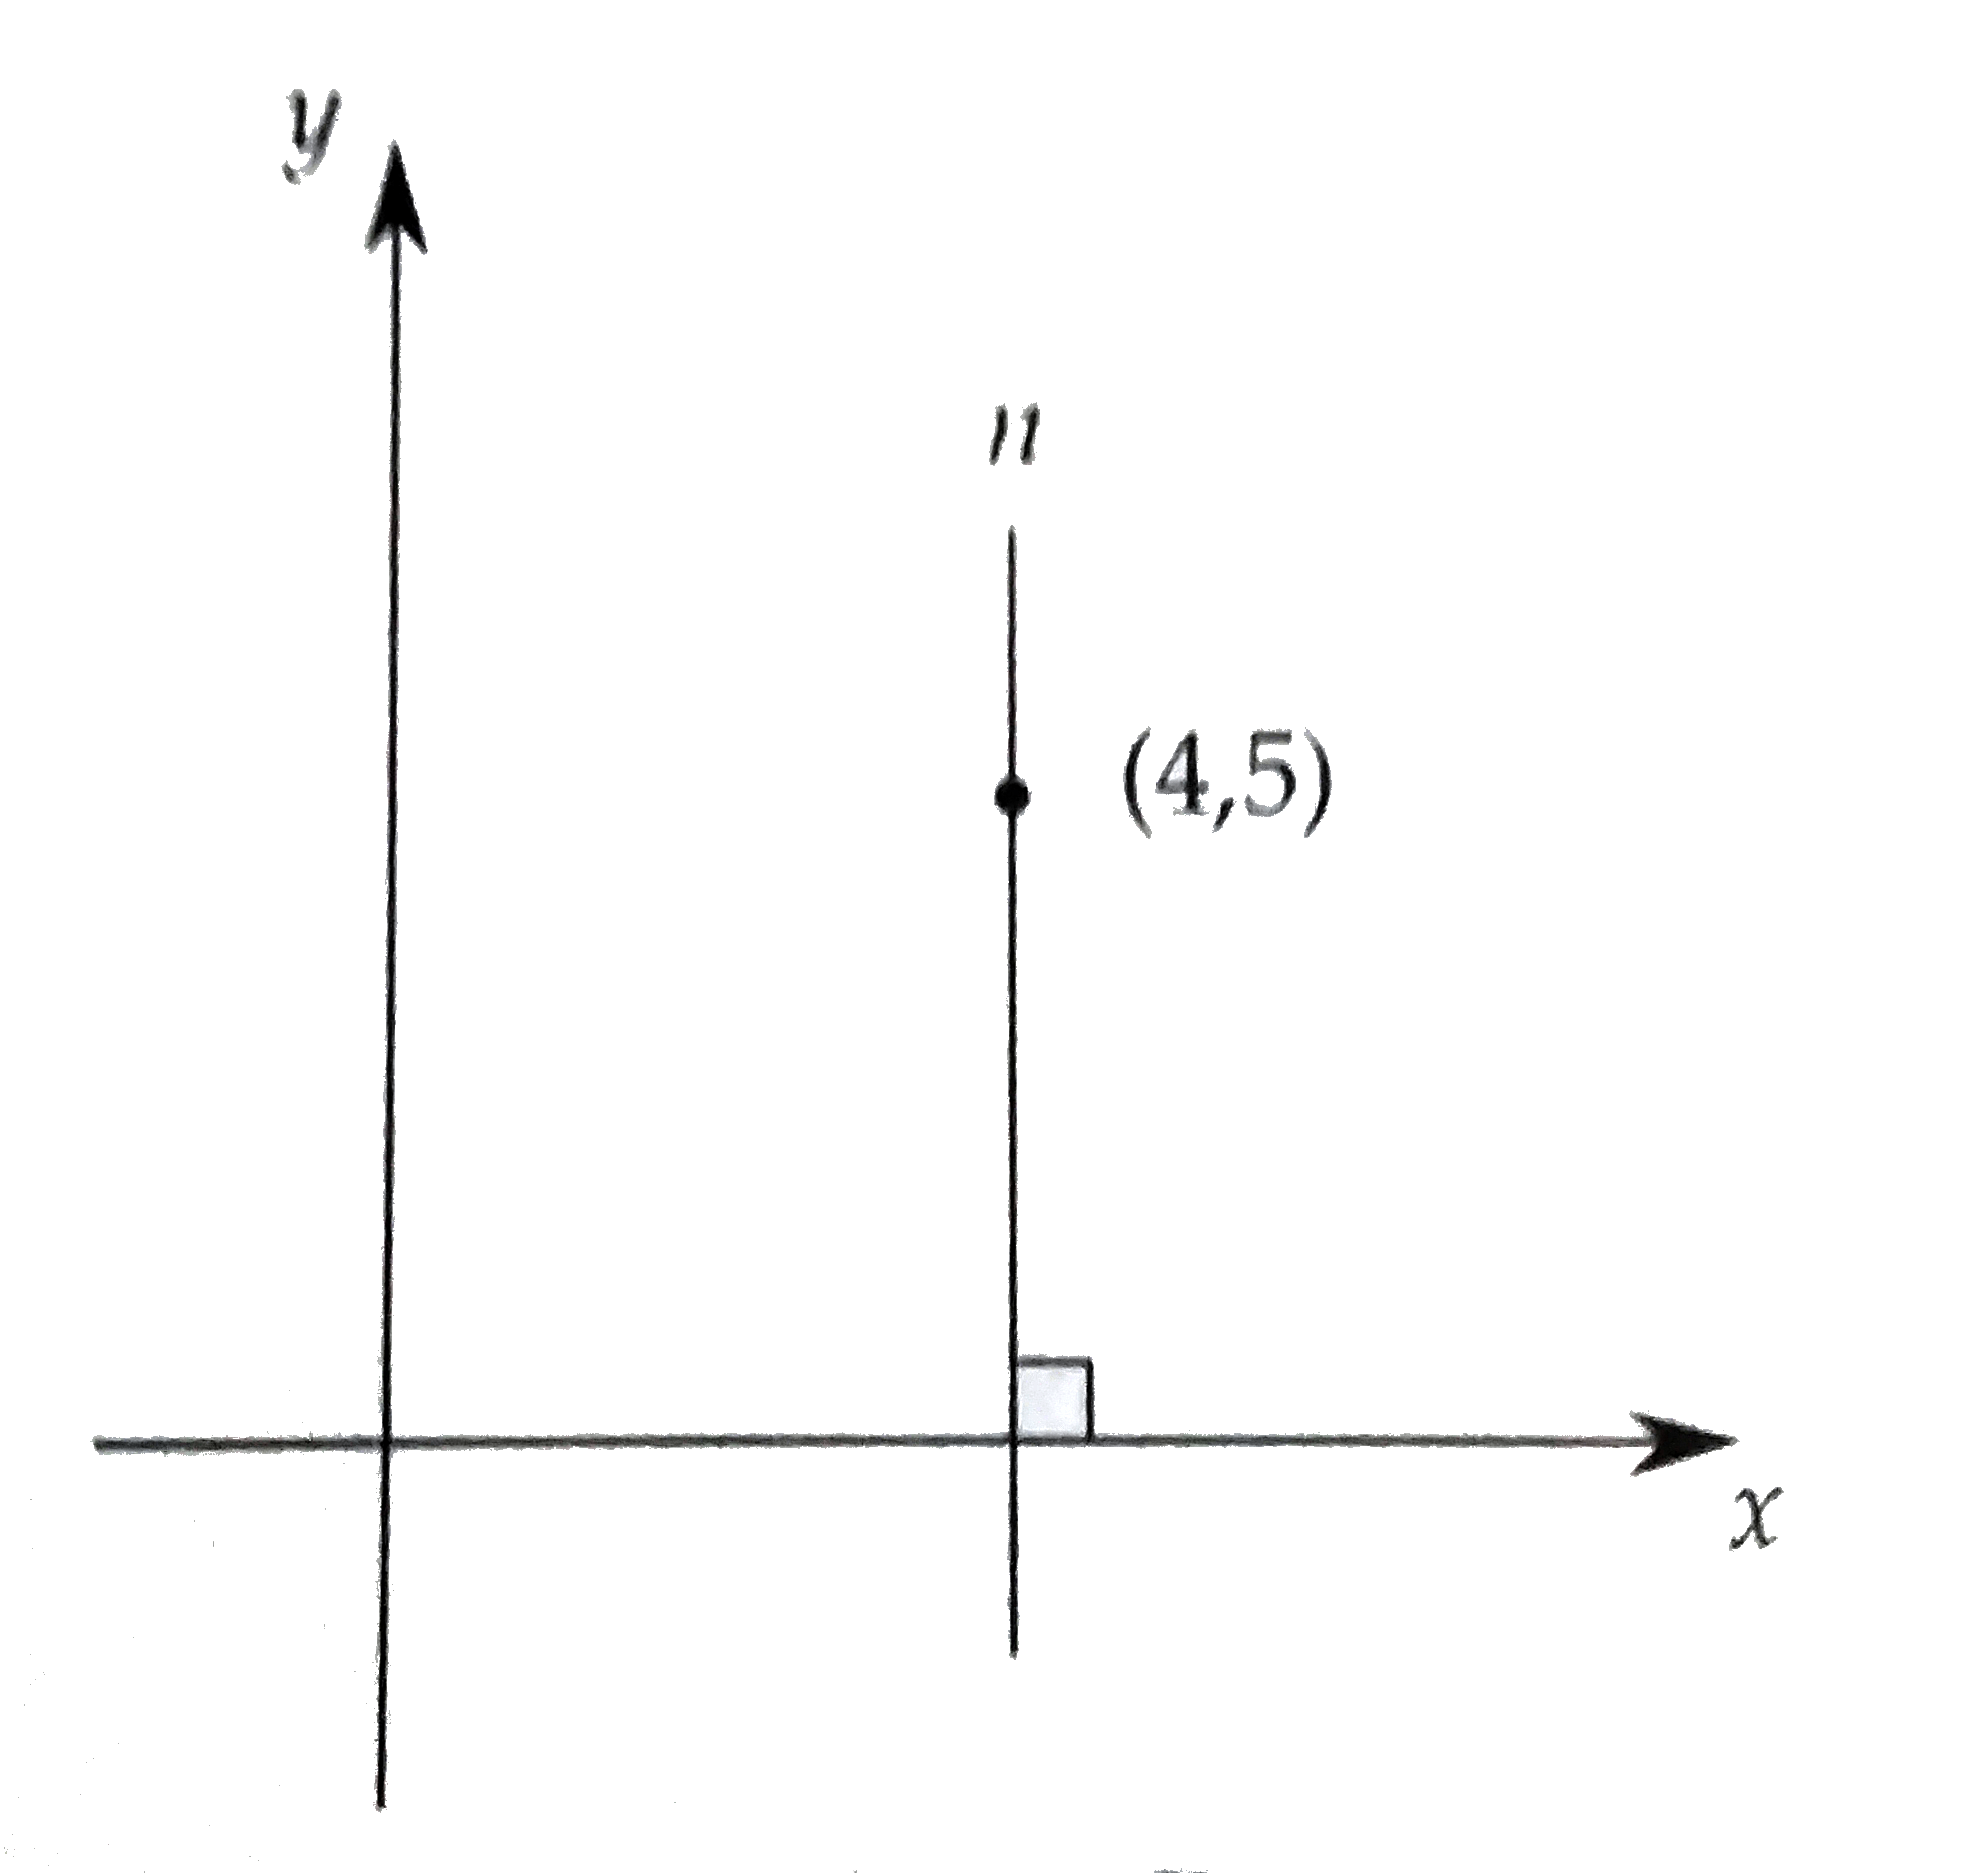
View SolutionFigure shows line n in a rectangular coordinate system. An equation of line n is

View SolutionFind the polar coordinates of the points whose cartesian coordinates are
(−2,−2)
View Solution
