Draw the graph of y=cot−1x.Solution in Tamil
Video Solution
Text Solution
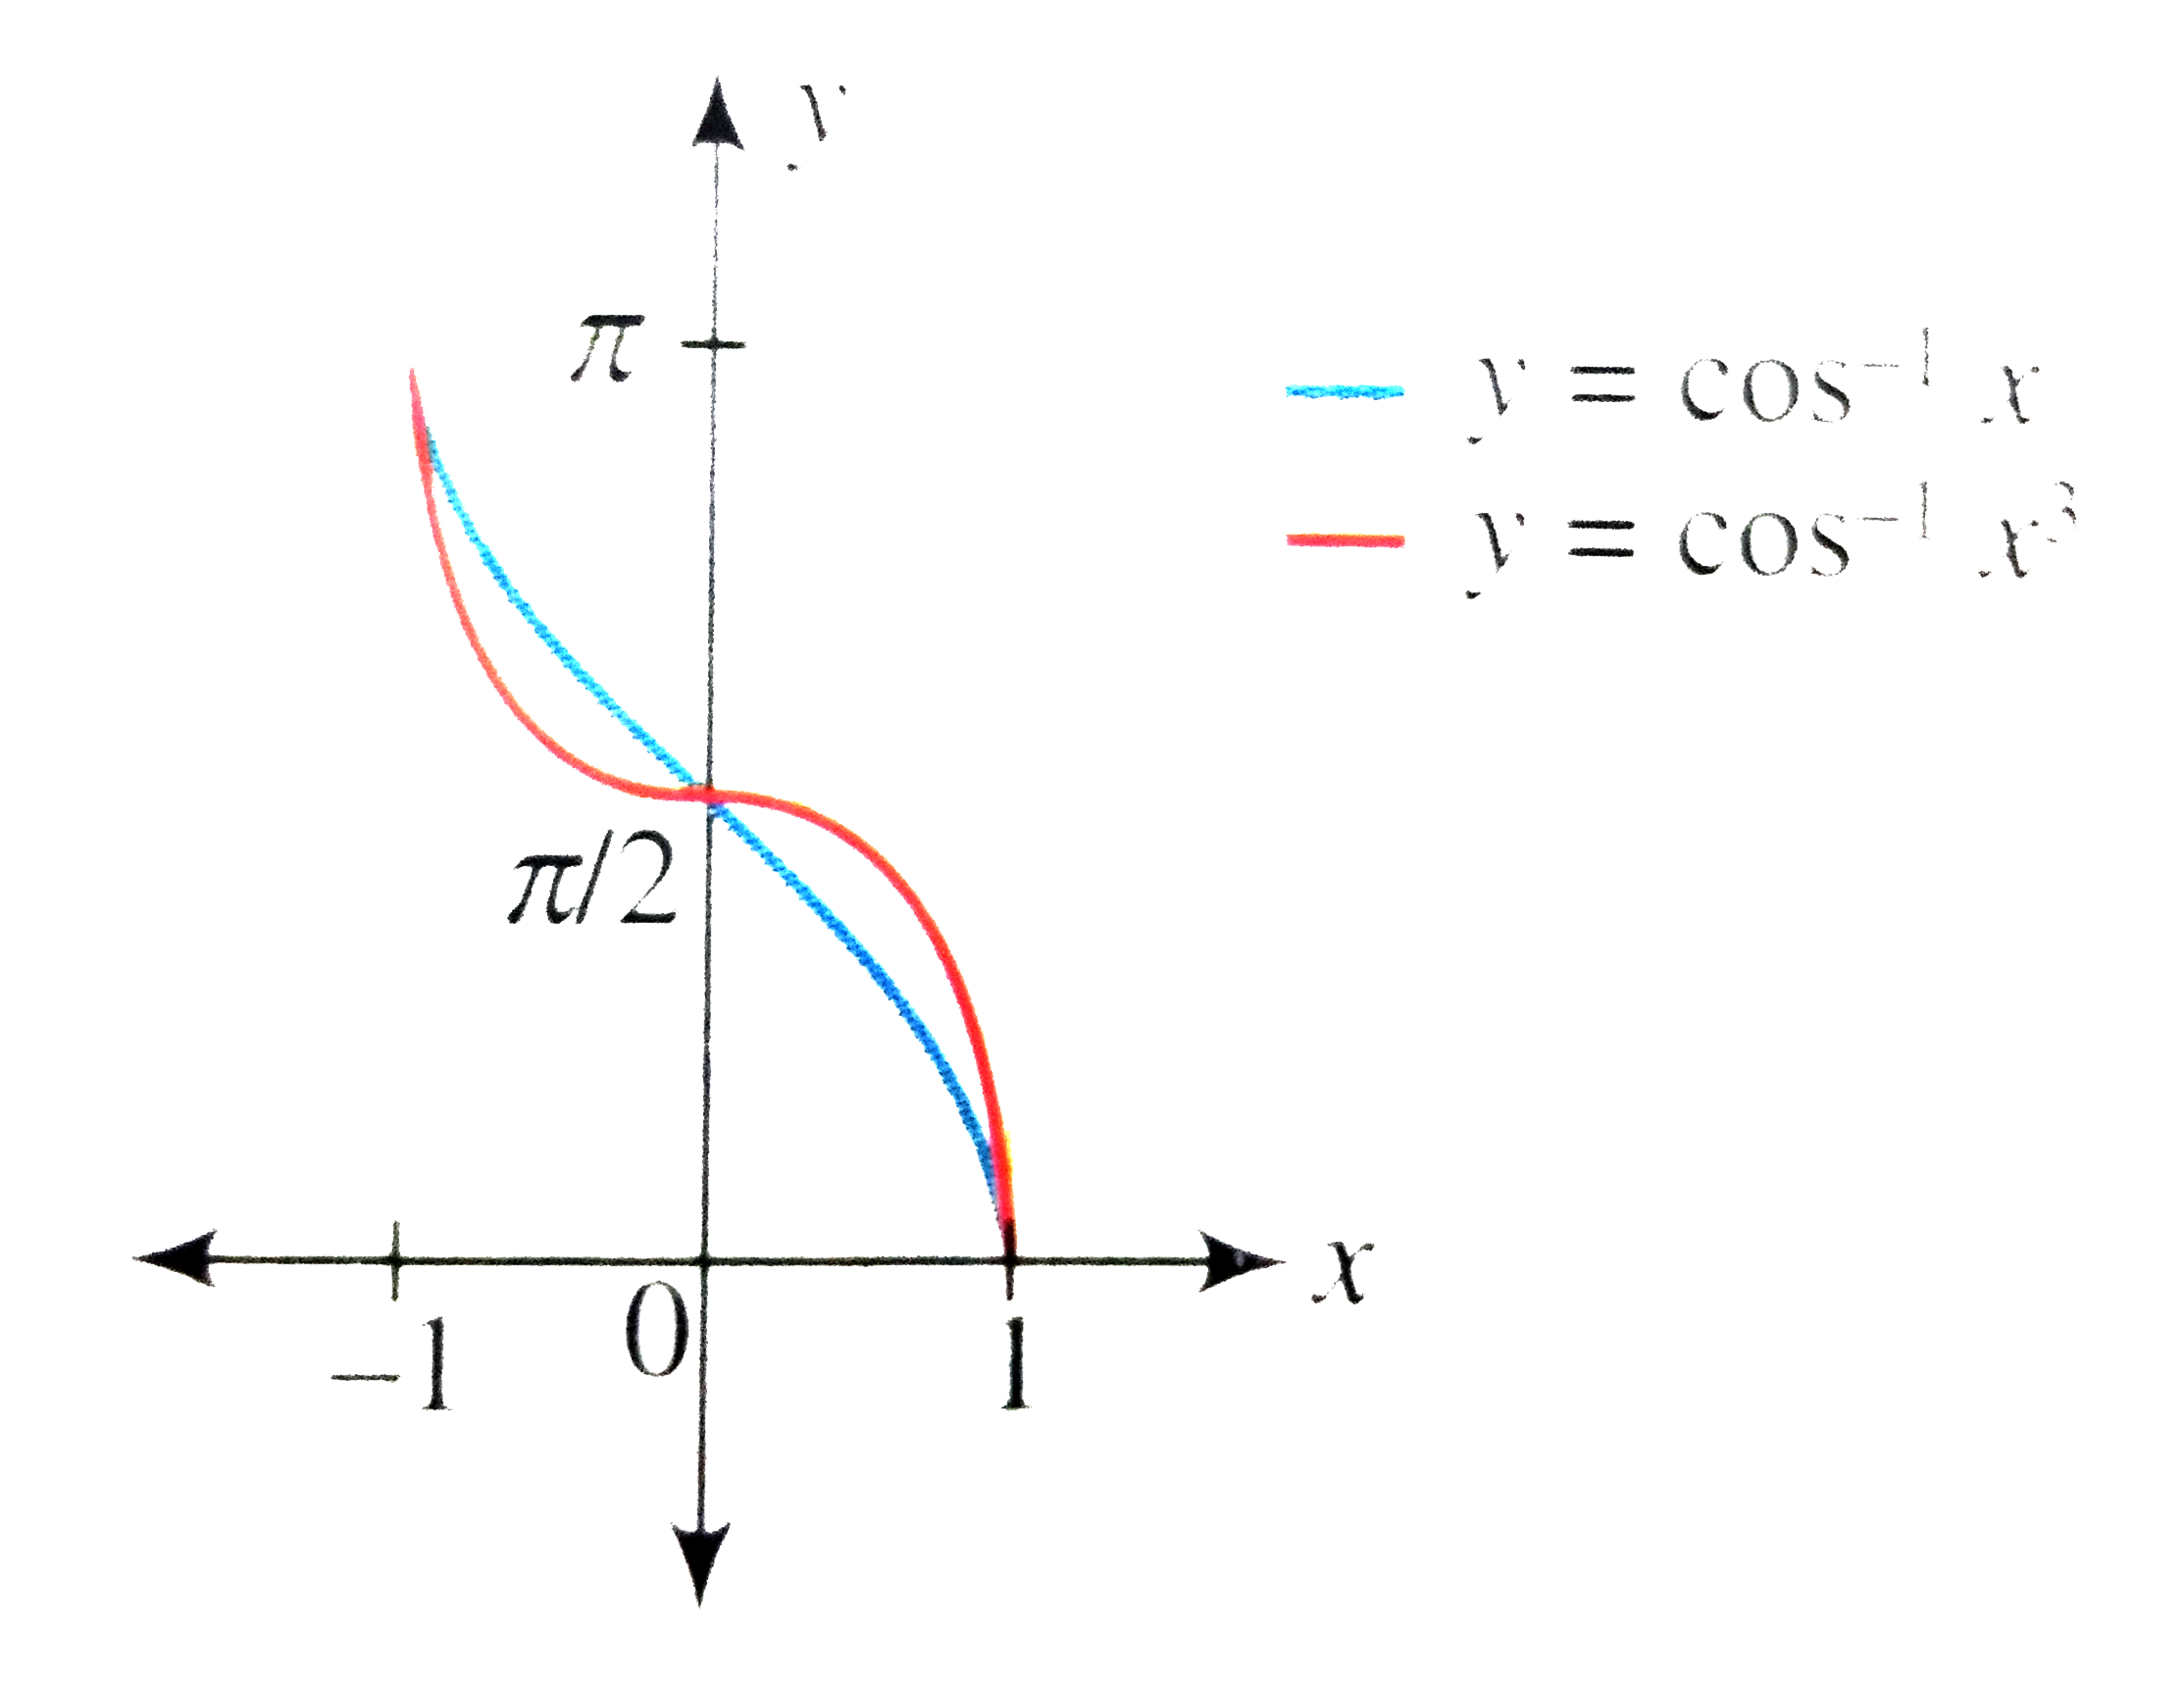
We have y=f(x)=cos−1x3
We must have −1≤x3≤1∴−1≤x≤1
Also cos−1x3 is decreasing as cos−1x is decreasing and x3 is increasing
f(−1)=cos−1(−1)3=cos−1(−1)=π
f(0)=cos−11=0
f(1)=cos−11=0
For −1≤x<0,x<x3∴cos−1x3, hence the graph of y=cos−1x3 line above the graph of y=cos−1x.
For −1≤x<0,x<x3∴cos−1x3<cos−1x3,hence the graph of y=cos−1x3line below the praph of y=cos−1x.
Therefore, the graphs of both functions are as show in the following figure.

|
Updated on:21/07/2023
Topper's Solved these Questions
- BOOK - CENGAGECHAPTER - GRAPH OF INVERSE TRIGONOMETRIC FUNCTIONSEXERCISE - Exercise18videos
GRAPH OF INVERSE TRIGONOMETRIC FUNCTIONS
- BOOK - CENGAGECHAPTER - GETTING STARTED WITH GRAPHSEXERCISE - Exercise18videos
GETTING STARTED WITH GRAPHS
- BOOK - CENGAGECHAPTER - GRAPHICAL TRANSFORMATIONSEXERCISE - Exercise14videos
GRAPHICAL TRANSFORMATIONS
Similar Questions
Draw the graph of y=tan−1x+cot−1x
01:00View SolutionDoes the following graph pass the vertical or horizontal line test ?
 01:13View Solution
Draw the graph of y=tan−1x−cot−1x.
01:22View SolutionDraw the graph of y=cot−1(−x).
04:34View SolutionDraw the graph of y=−cot−1x.
01:36View SolutionDraw the graph of y=tan−1x−cot−1x.
01:42View SolutionDraw the graph of y=cot−1|x|.
01:53View SolutionDraw the graph of y=cot−1(cotx)
02:15View SolutionDraw the graph of y=tan−1x+cot−1x
00:59View SolutionDraw the graph of y=cot−1(−x).
04:47View SolutionDraw the graph of y=−cot−1x.
01:23View SolutionDraw the graph of y=cot−1|x|.
01:48View SolutionDraw the graph of y=cot−1(cotx)
02:22View SolutionDraw the graph of y=tan−1x+cot−1x
02:07View SolutionDraw the graph of y=-cot^(-1)x .
01:26View SolutionDraw the graph of y=tan^(-1)x-cot^(-1)x .
04:47View Solution

