Consider the following equilibrium
N2O4(g)⇔2NO2(g)
Then the select the correct graph , which shows the variation in concentratins of N2O4 Against concentrations of NO_(2):Solution in Punjabi
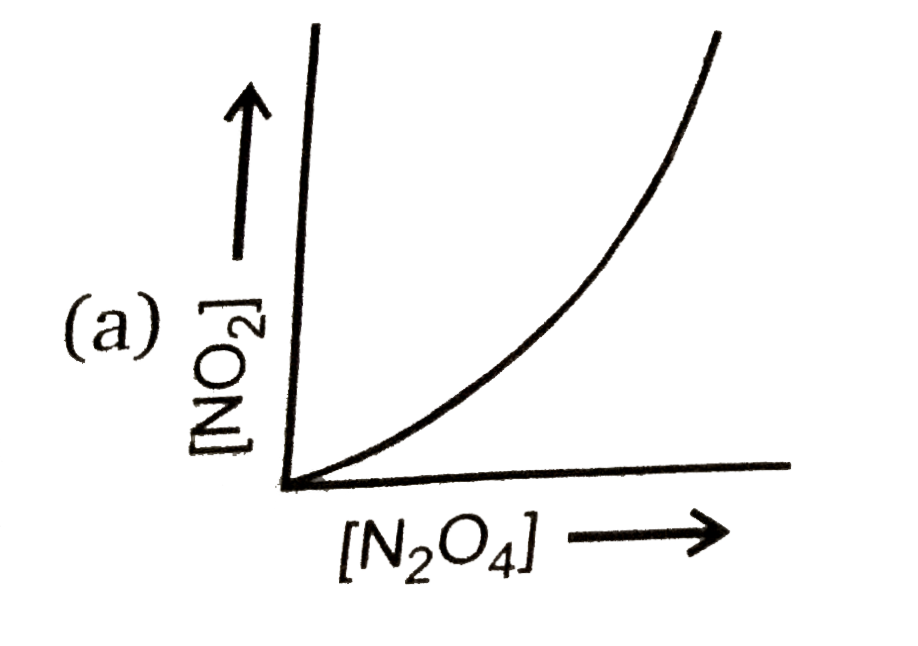
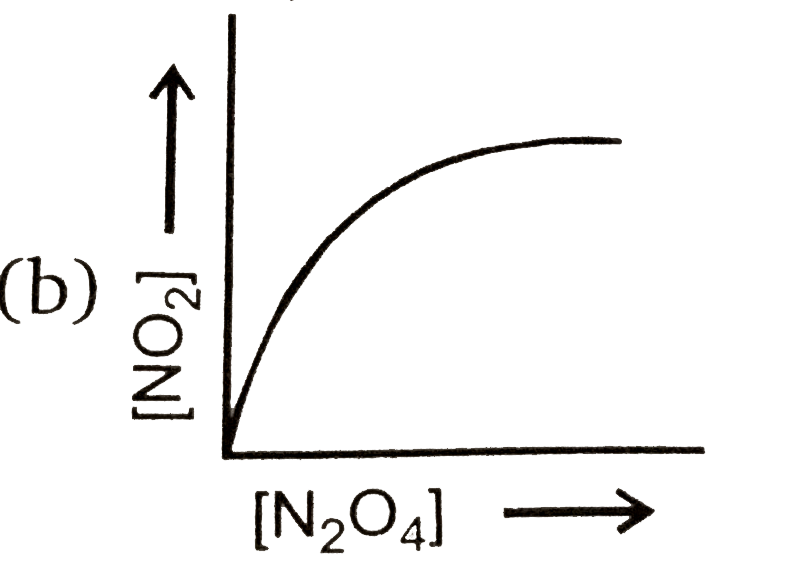
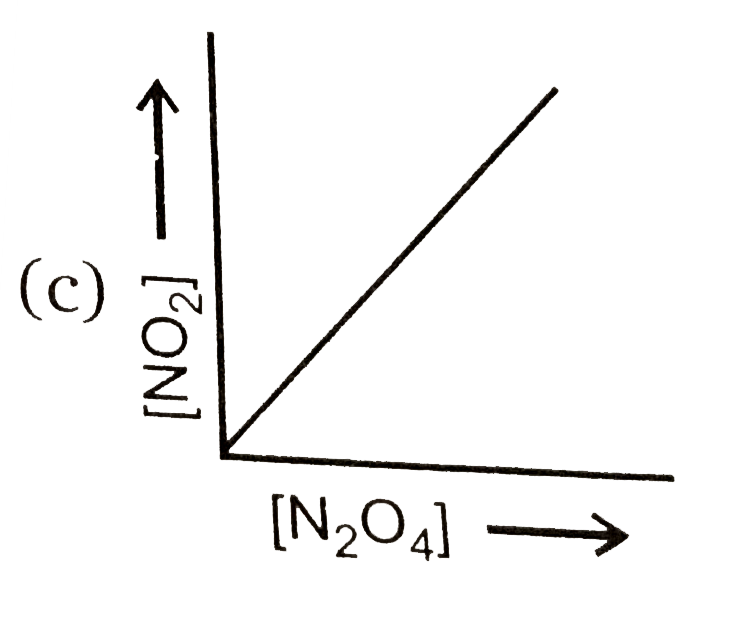
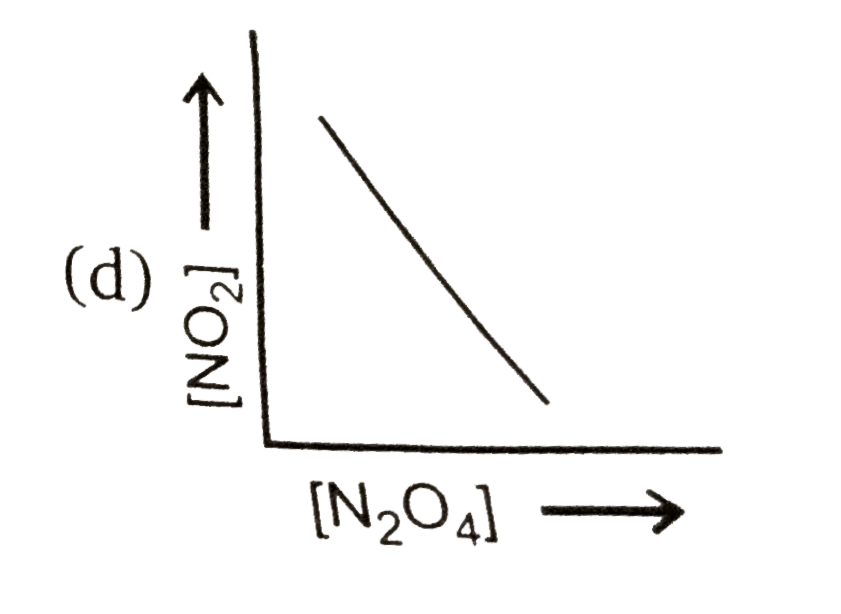
The correct Answer is:b
Step by step video & image solution for Consider the following equilibrium N_(2)O_(4)(g)hArr2NO_(2)(g) Then the select the correct graph , which shows the variation in concentratins of N_(2)O_(4) Against concentrations of N_O_(2): by Chemistry experts to help you in doubts & scoring excellent marks in Class 11 exams.
Updated on:21/07/2023Topper's Solved these Questions
- CHEMICAL EQUILIBRIUMBOOK - NARENDRA AWASTHICHAPTER - CHEMICAL EQUILIBRIUMEXERCISE - Level 1 (Q.93 To Q.122)
1 Videos
- CHEMICAL EQUILIBRIUMBOOK - NARENDRA AWASTHICHAPTER - CHEMICAL EQUILIBRIUMEXERCISE - Level 2
1 Videos
- ATOMIC STUCTUREBOOK - NARENDRA AWASTHICHAPTER - ATOMIC STUCTUREEXERCISE - level 2
1 Videos
- DILUTE SOLUTIONBOOK - NARENDRA AWASTHICHAPTER - DILUTE SOLUTIONEXERCISE - Level 3 - Match The Column
1 Videos
Similar Questions
A sample of nitrogen gas occupies a volume of 1.0L at a pressure of 0.5 bar and at 40∘C. Calculate the pressure the gas if compressed to 0.225ml at −6∘C
View SolutionCalculate ΔrG for the reaction at 27∘C
H2(g)+2Ag+(aq)⇔2Ag(s)+2H+(aq)
Given : PH2=0.5 bar, [Ag+]=10−5M,
[H+]=10−3M,ΔrG∘[Ag+(aq)]=77.1kJ/mol
View SolutionA small piece of mass m moves in such a way the P.E. =−12mkr2. Where k is a constant and r is the distance of the particle from origin. Assuming Bohr's model of quantization of angular momentum and circular orbit, r is directly proportional to :
View SolutionColumn -I and Column -II contain four entries each. Entries of column-I are to be matched with some entries of column-II. One or more than one entries of column-I may have the matching with the same entries of column-II.

View SolutionN2O4 dissociates as
N2O4(g)⇔2NO2(g)
At 40∘C and one atmosphere % decomposition of N2O4 is 50.3%. At what pressure and same temperature, the equilibrium mixture has the ratio of N2O4:NO2 as 1:8?
View SolutionDensity of equilibrium mixture of N2O4 and NO2 at 1atm and 384K is 1.84gdm−3. Calculate the equilibrium constant of the reaction.
N2O4⇔2NO2
View SolutionIf the equilibrium constant for the reaction, N2O4⇔2NO2 is K=[NO2]2/[N2O4], then which of the graphs are correct at constant temperature?
View SolutionConsider folllowing reaction at 300 K : N_(2)O_(5)(g)hArrN_(2)O_(5)(g)+O_(2)(g) K_(c)=5 N_(2)O_(5)(g)hArrN_(2)O(g)+O_(2)(g) If 4 moles N_(2)O_(5) is kept in 1 L, Container to attain equilibrium and at equilibrium 5 moles of O_(2) are produced, then at equilibrium 5 moles of O_(2) are produced, then at equilibrium moles of N_(2)O_(3) will be :
View SolutionConsider the following equilibrium
N2O4(g)⇔2NO2(g)
Then the select the correct graph , which shows the variation in concentratins of N2O4 Against concentrations of N2O_(4):
View SolutionVapour density of the equilibrium mixture of NO_(2) "and" N_(2)O_(4) is found to be 38.33 . For the equilibrium N_(2)O_(4)(g)hArr2NO_(2)(g) . Calculatedegree of dissociation.
View SolutionAt the equilibrium of the reaction , N_(2)O_(4)(g)rArr2NO_(2)(g) , the observed molar mass of N_(2)O_(4) is 77.70 g . The percentage dissociation of N_(2)O_(4) is :-
View SolutionIf in the reaction N_(2)O_(4)hArr2NO_(2),alpha is that part of N_(2)O_(4) which dissociates, then the number of moles at equilibrium will be
View SolutionIf in the reaction, N_(2)O_(4)(g)hArr2NO_(2)(g), alpha is the degree of dissociation of N_(2)O_(4) , then the number of moles at equilibrium will be
View SolutionAt the equilibrium of the reaction N_(2)O_(4) (g) rarr 2NO_(2)(g) the observed molar mass of N_(2) O_(4) is 77.7 gm . The percentage dissociation of N_(2)O_(4) is
View SolutionFor the dissociation equilibrium,
N2O4(g)⇔2NO2(g), the variation of free energy with the fraction of N2O4 dissociated under standard conditions is shown in the figure :
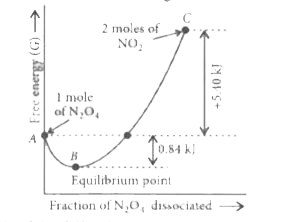
Which of the following statements is/are correct?
View SolutionConsider the following equilibrium
N2O4(g)⇔2NO2(g)
Then the select the correct graph , which shows the variation in concentrations of N2O4 against concentrations of NO2:
View Solution
