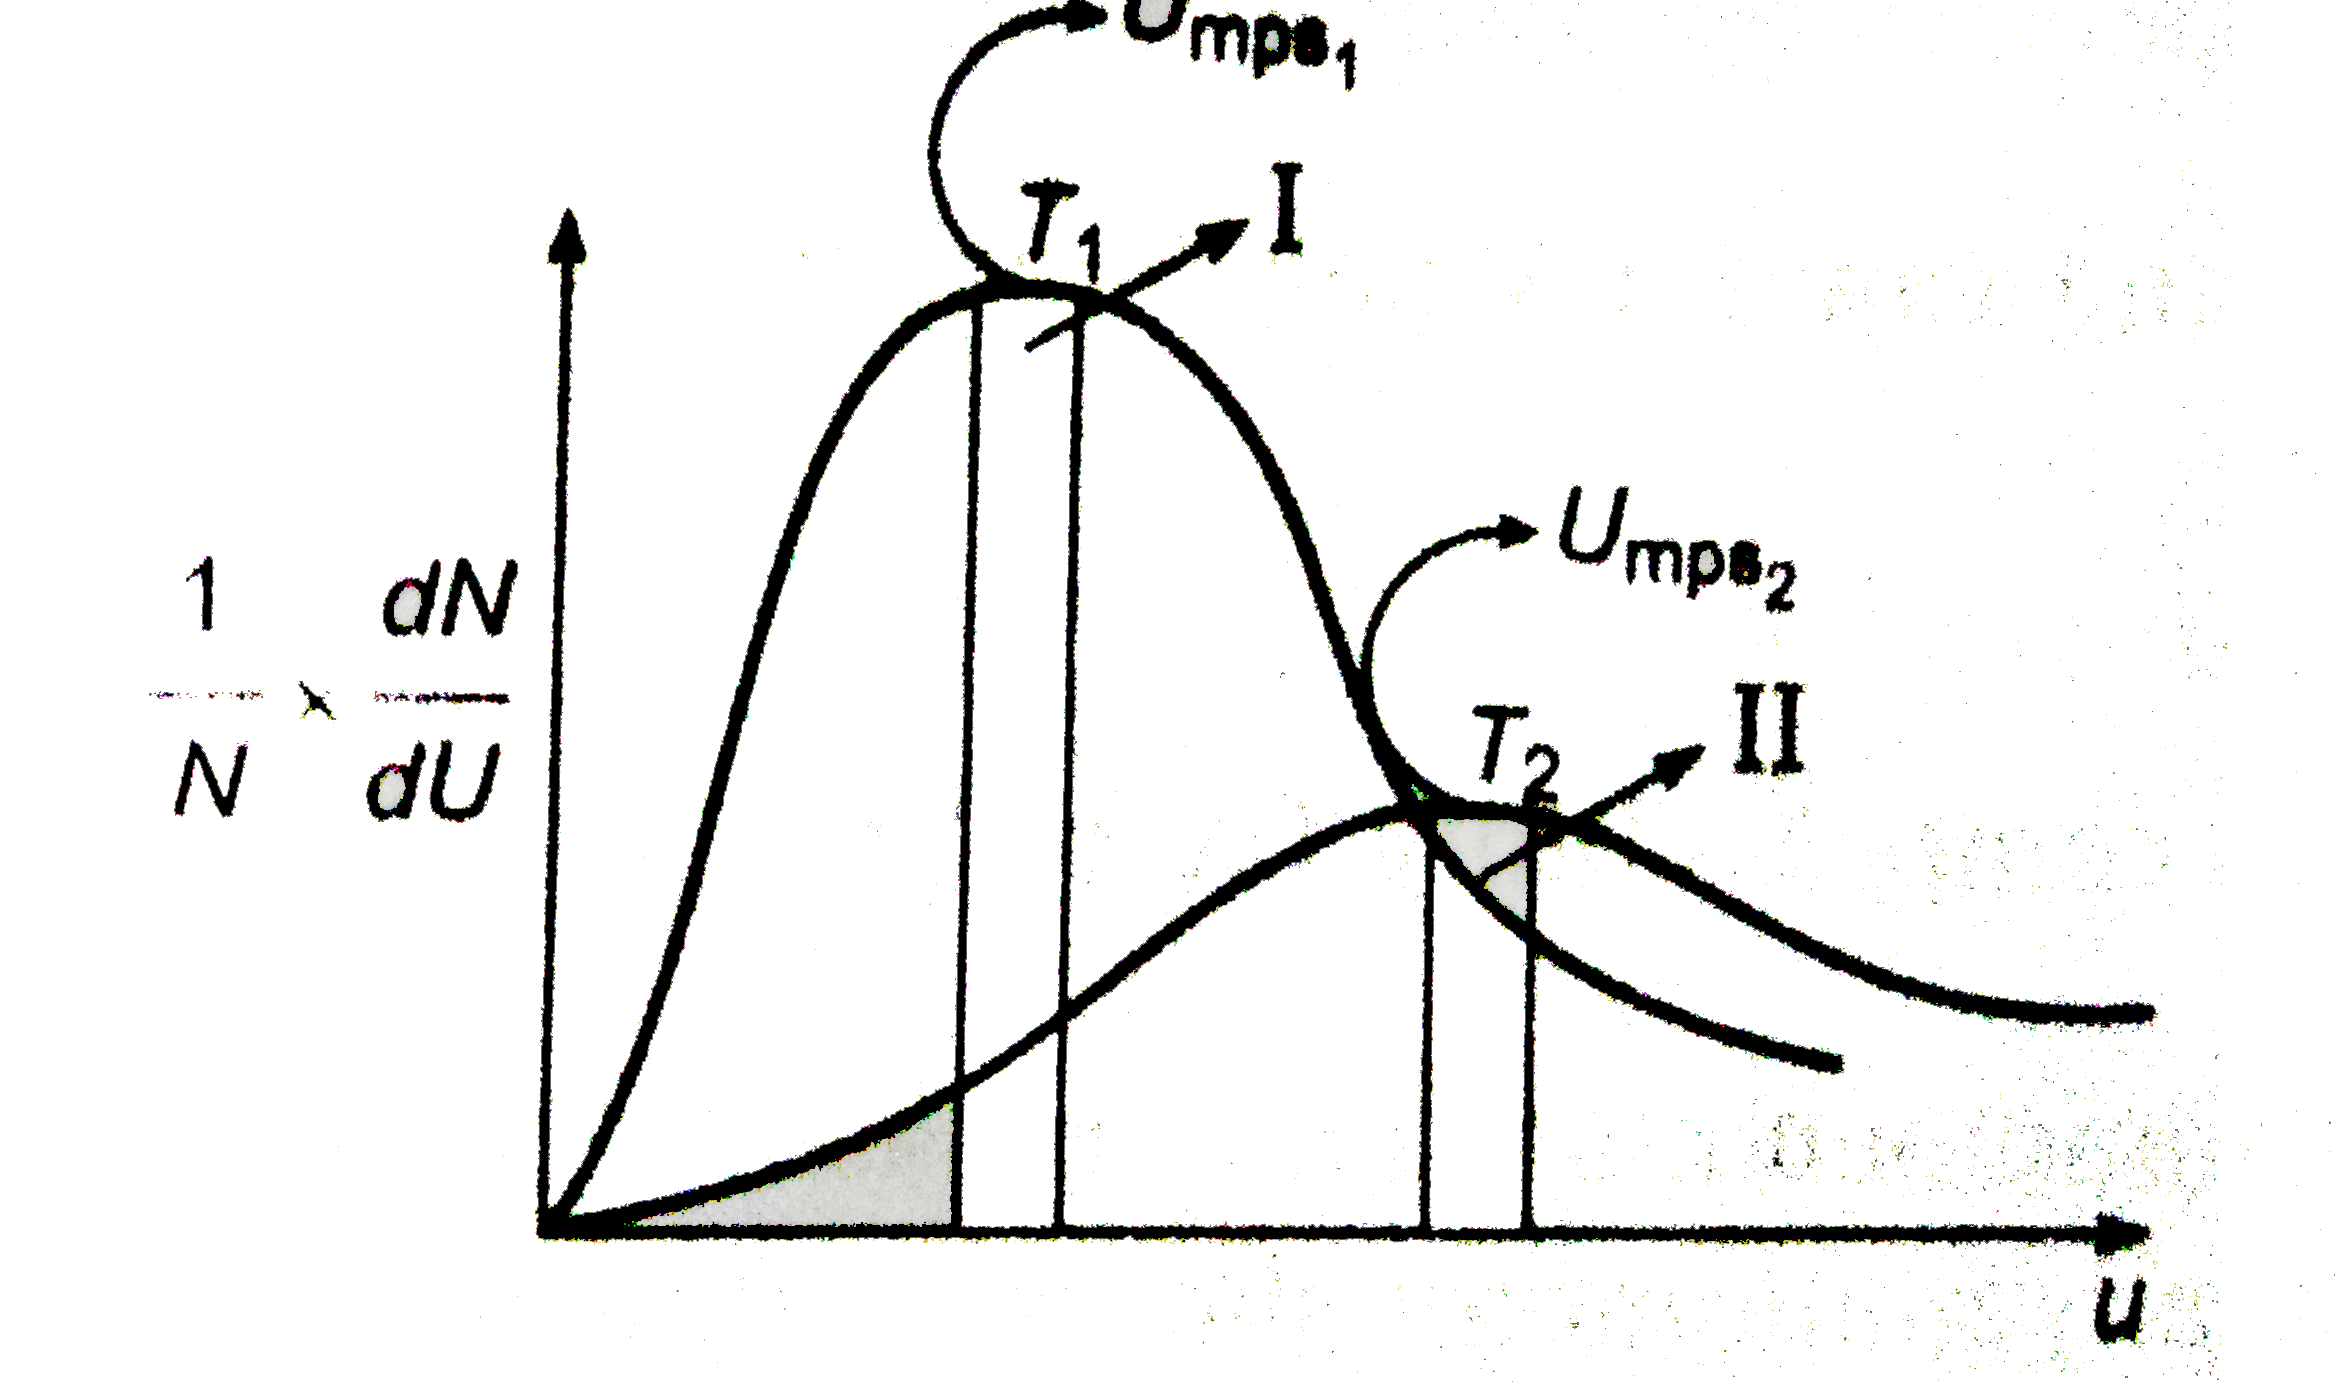
According to Maxwell.s distribution of molecular speeds, for the below graph drawn for two different samples of gases A and B al temperature T1 and T2 respectively, which of the following statements in are incorrect?
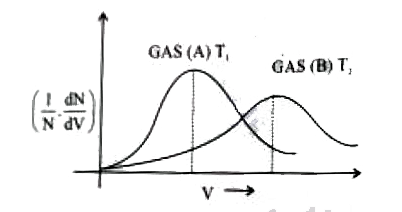
If T1=T2 then molecular mass of gas B(MB) is greater than molecular mass of gas A(MA).
If molecular mass of gas A(MA)is equal to molecular mass of gas B(MB) then T1>T2
If T1>T2, then molecular mass of gas B(MB) is necessarily less than molecular mass of gas A(MA)
All of these
The correct Answer is:D
At constant temperature, decrease in molecular mass causes flattening of the graph. For same molecular mass of gas, increase in temperature causes flattening of the graph.
(Vmp)T1<(Vmp)T2
Topper's Solved these Questions
- BOOK - PHYSICS WALLAHCHAPTER - STATES OF MATTEREXERCISE - LEVEL - 260videos
STATES OF MATTER
- BOOK - PHYSICS WALLAHCHAPTER - STATES OF MATTEREXERCISE - NEET PAST 5 YEARS QUESTIONS14videos
STATES OF MATTER
- BOOK - PHYSICS WALLAHCHAPTER - SOLUTIONSEXERCISE - NEET PAST 5 YEARS QUESTIONS7videos
SOLUTIONS
- BOOK - PHYSICS WALLAHCHAPTER - STRUCTURE OF ATOM EXERCISE - Level-140videos
STRUCTURE OF ATOM
Similar Questions
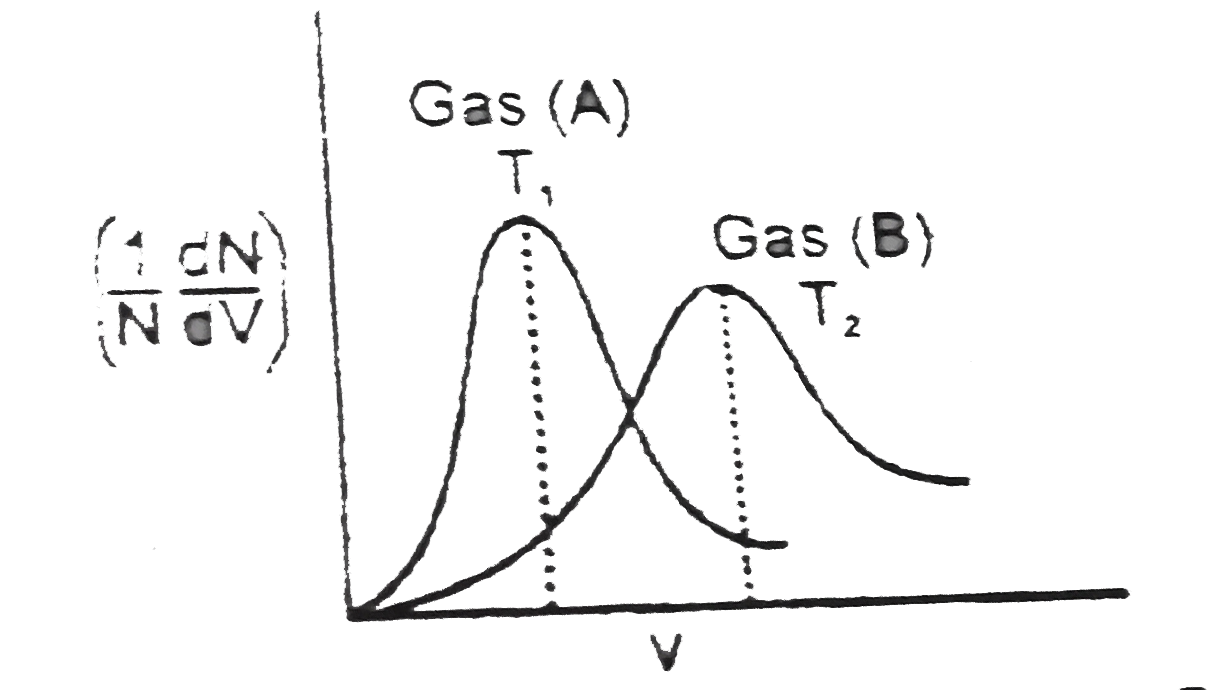
According to Maxwell's distribution of molecular speeds, the following graph has been drawn for two different samples of gases A and B at temperature T1andT2 respectively.Then, give the correct set of INCORRECT statements : Report your answer as sum of the numbers of incorrect statements.
For examples, if statements (1) and (2) are incorrect, then report answer as (1+2)=3
 View Solution
According to Maxwell's distribution of molecular speeds, the following graph has been drawn for two different samples of gases A and B at temperature T1andT2 respectively.Then, give the correct set of INCORRECT statements : Report your answer as sum of the numbers of incorrect statements.
For examples, if statements (1) and (2) are incorrect, then report answer as (1+2)=3
 View Solution
Knowledge Check
- Question 1 - Select One or More
For the following graph, drawn from two different samples of gases at two different temperatures T1andT2, which of the following statements is/are necessarily true?
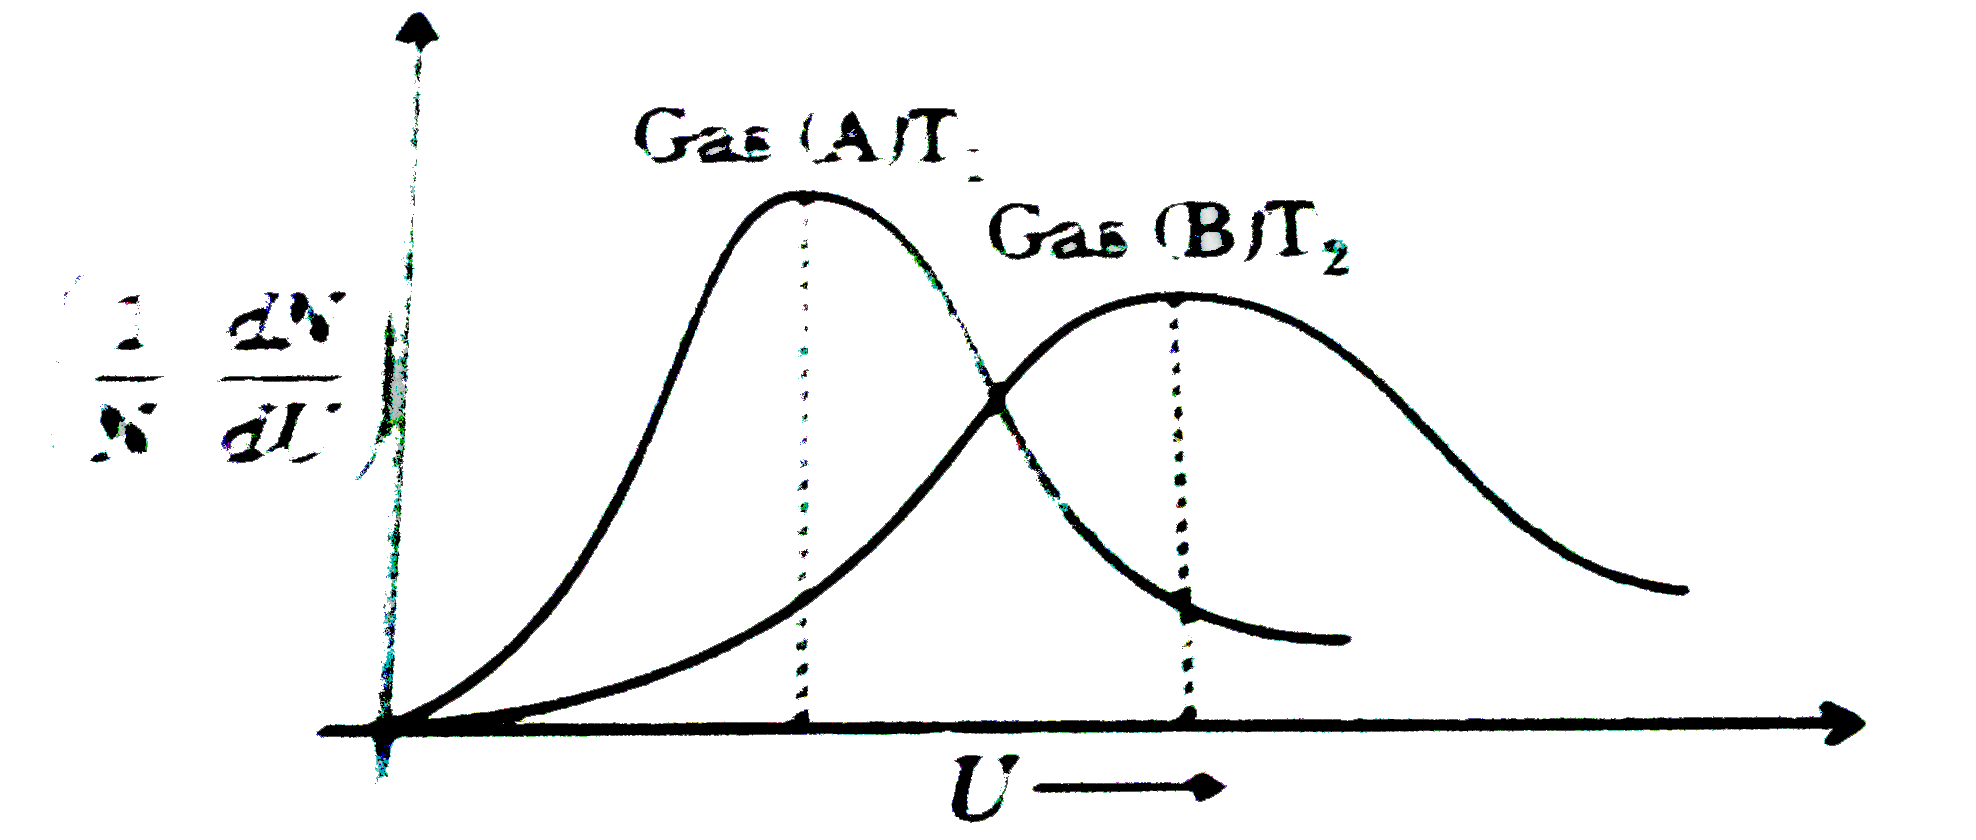 Aif T2>T1,MB is necessarily greater than MABif T1>T2,MA is necessarily greater than MBCT2MB>T1MADNothing can be predicted.
 - Question 2 - Select One
If two gases A and B and temperatures TA and TB respectively have identical Maxwellian plots, then which of the following statements is true?
ATB=TABMB=MACTAMB=TBMADGases A and B may be O2 and SO2 at 27∘C and 327∘C respectively. - Question 3 - Select One
The distribution of molecular speeds for CO2 at different temperatures is given below, which of the following statements is incorrect?
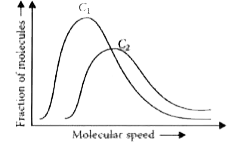 AIt represents Maxwell's distribution curve.BTemperature of C2 graph is more than that of C1.CThe average velocity of molecules in C2 graph is more than C1.DVelocity ∝1√M, therefore, molecular mass of molecules in C1<C2.
Following represents the Maxwell distribution curve for an ideal gas at two temperature T1 and T2 . Which of the following option(s) is/are true?
 View Solution
Following represents the Maxwell distribution curve for an ideal gas at two temperature T1 and T2 . Which of the following option(s) is/are true?
 View Solution
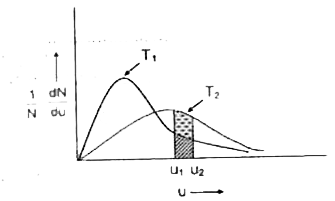
Read the following paragraph and answer the questions given below:
According to Maxwell distribution, the area under the curve is equal to the total number of molecules in collision. On increasing temperature, fraction of molecules having speed equal to ump (most probable speed) decreases. The speed distribution also depends on the mass of the molecules along with the temperature.
In general, the distribution depends upon the value of MT (where M is molar mass and T is temperature in kelvin).
Choose the correct option:
On increasing temperature, which of the following statement is incorrect?View SolutionThe gas molecules randomly move in all directions and collide with each other and with the wall of the container. If is difficult to determine the speed of an individual molecule but it had become passible to work out the distribution of molecules among different molecular speeds. This is known as Maxwell Boltzmann distribution
consider the following graph about Maxwell's distribution of speed at two different temperature T1 and T2
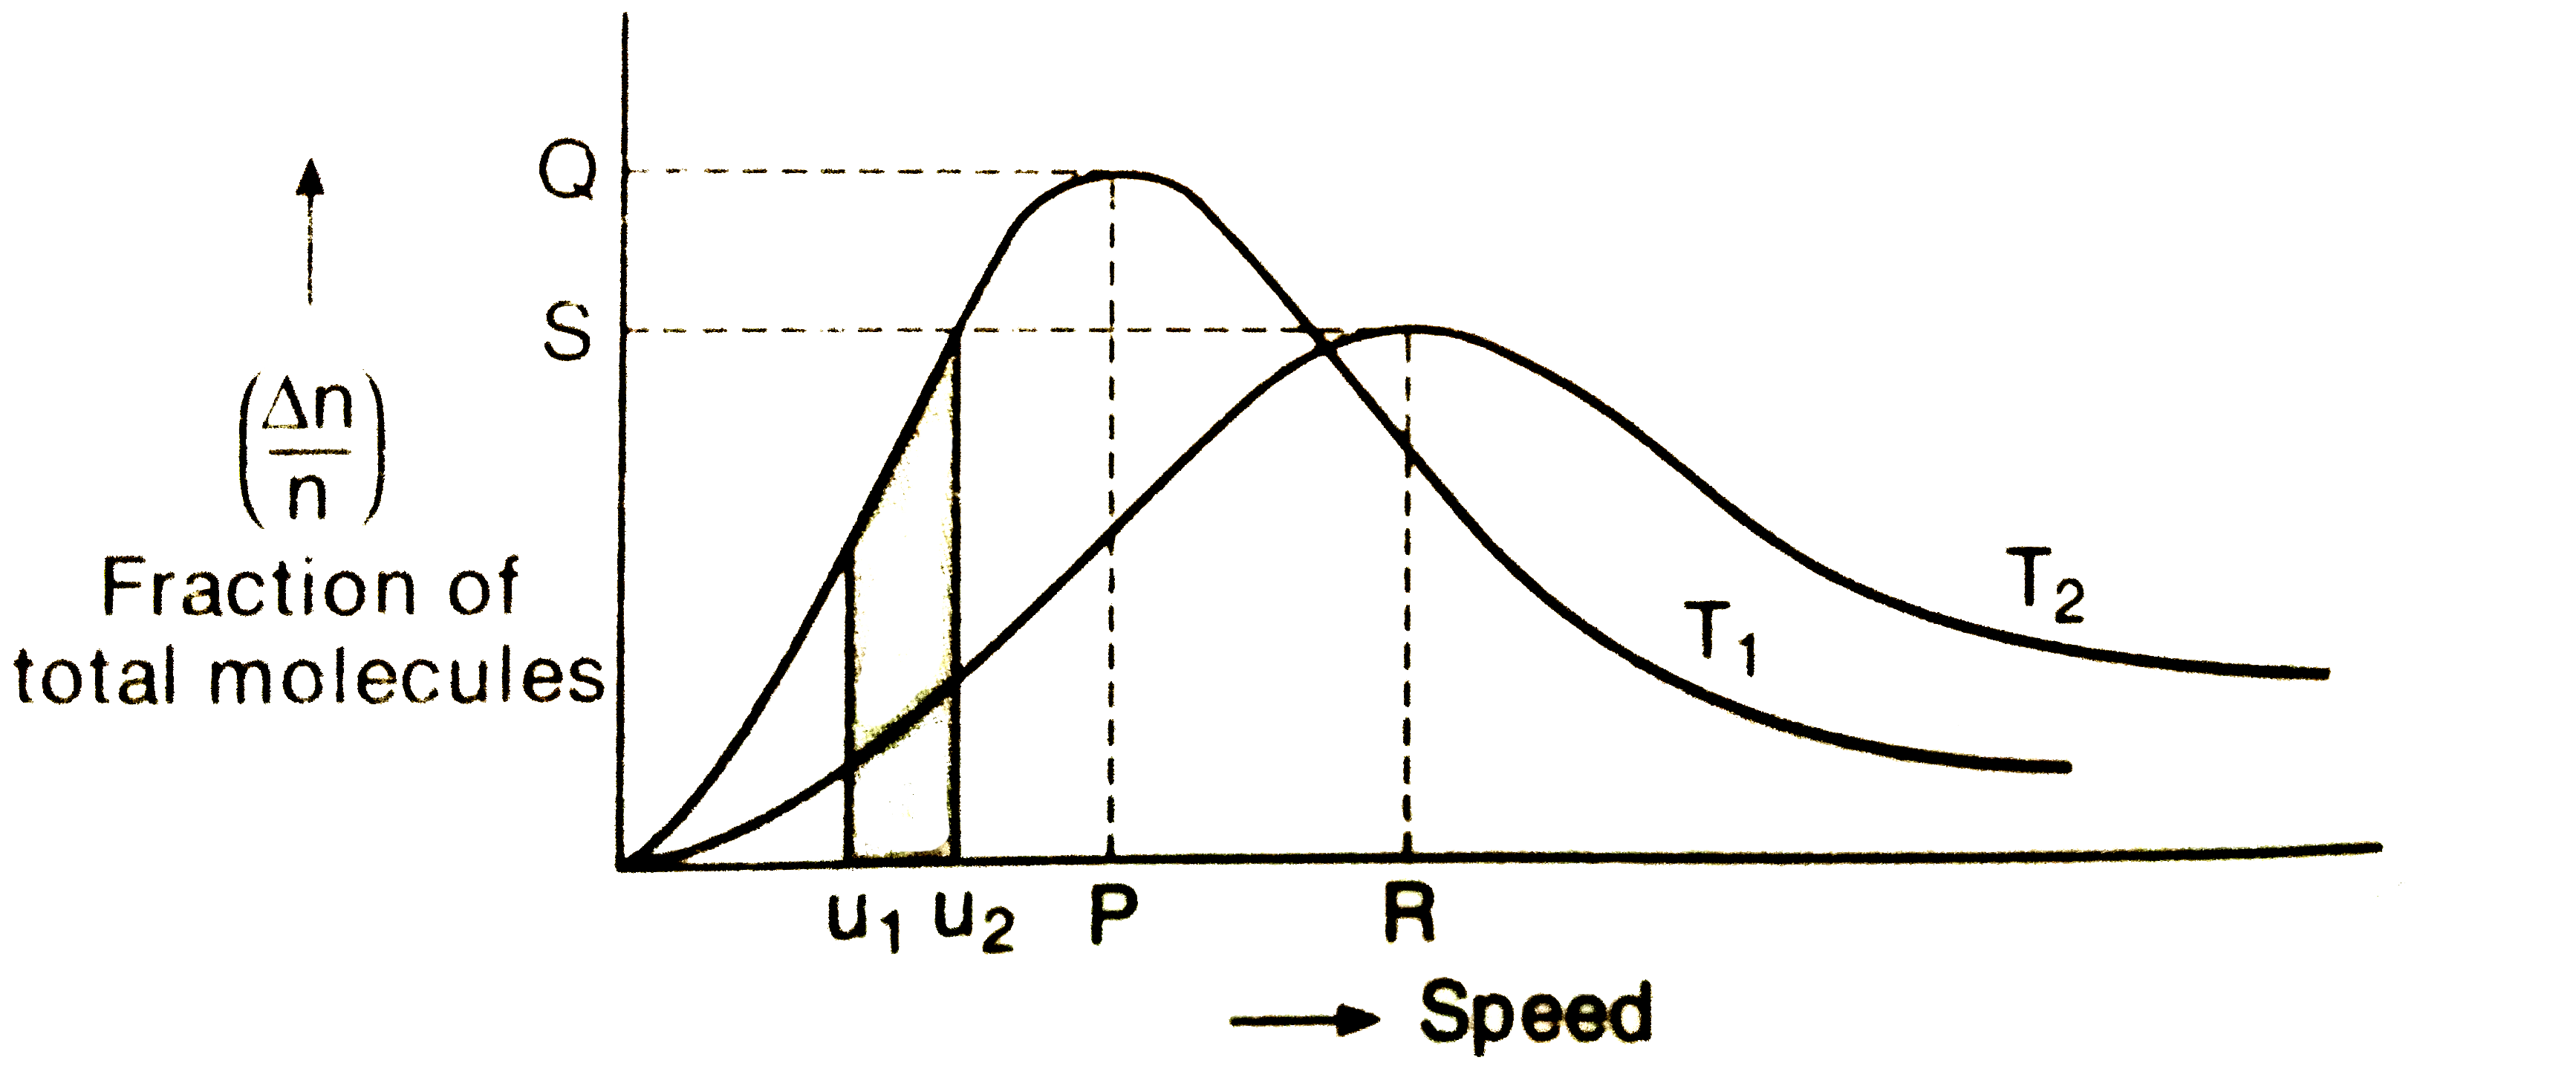
The curve has which of the following characteristics ?
(i) It has symmetrical distribution of molecules against molecular velocity
(ii) The area under the curve gives the total number of molecules.
(iii) The maxima of teh curve shifts towards right as the temperature is raised.
(iv) The area under the curve is independent of temperature
Select the correct statements from the codes given below:View SolutionFor two gases A and B,P v/s V isotherms are drawn at T K as shown, TA & TB are critical temepratures of A & B respectively
Which of the following is true ?
 View Solution

