Draw-the graph of the region which represents the solution set of the inequality y≥2Solution in Assamese
Step by step video & image solution for Draw-the graph of the region which represents the solution set of the inequality yge2 by Maths experts to help you in doubts & scoring excellent marks in Class 11 exams.
Similar Questions
Draw the graph of the solution set of the inequations 2x+y≥2,x−y≤1,x+2y≤8,x≥0andy≥0, also shade the solution region. (Graph paper not necessary)
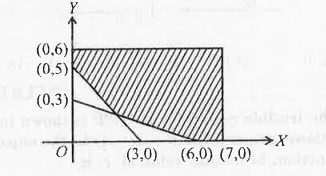
06:05View SolutionFind the linear inequations for which the shaded area in fig. 15.41 is the solution set. Draw the diagram of the solution set of the linear inequations.
04:07View SolutionThe linear inequality |x|≤5 of which write the solution set and draw graph.
02:55View SolutionThe vertex of common graph of inequalities 2x+yge2 and x-yle3 , is
02:24View SolutionDraw the graph of the solution set of the inequations 2x+y≥2,x−y≤1,x+2y≤8,x≥0and y≥0also shade the solution region .(graph paper not necessary).
06:40View SolutionThe shaded region in the following figure is the solution set of the inequations,
 05:58View Solution
Draw-the graph of the region which represents the solution set of the inequality xge1
01:56View SolutionDraw-the graph of the region which represents the solution set of the inequality xle4
01:36View Solution

