Draw-the graph of the region which represents the solution set of the inequality −5≤x≤5Solution in Assamese
Step by step video & image solution for Draw-the graph of the region which represents the solution set of the inequality -5lexle5 by Maths experts to help you in doubts & scoring excellent marks in Class 11 exams.
Updated on:21/07/2023Similar Questions
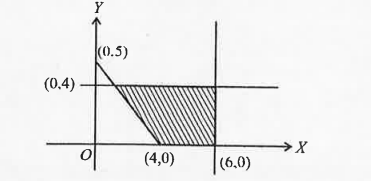
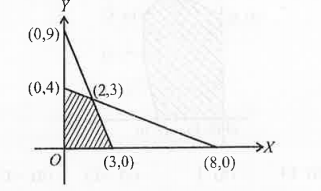
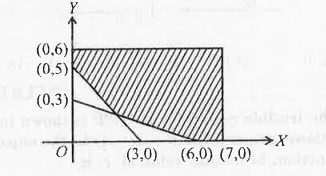
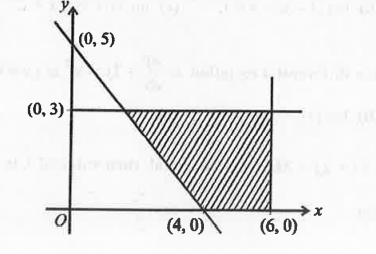
Find the linear inequations for which the shaded area in fig. 15.41 is the solution set. Draw the diagram of the solution set of the linear inequations.
View SolutionThe linear inequality |x|≤5 of which write the solution set and draw graph.
View SolutionDraw the graph of the solution set of the inequations 2x+y≥2,x−y≤1,x+2y≤8,x≥0and y≥0also shade the solution region .(graph paper not necessary).
View SolutionThe shaded region in the following figure is the solution set of the inequations,

View SolutionThe shaded region in the following figure is the solution set of the inequations,

View SolutionThe shaded region in the following figure is the solution set of the inequations,

View SolutionThe shaded region in the figure is the solution set of the inequations

View SolutionDraw-the graph of the region which represents the solution set of the inequality xge1
View Solution
