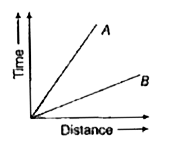
Two students were asked to plot a distance-time graph for the motion described by Table A and Table B.
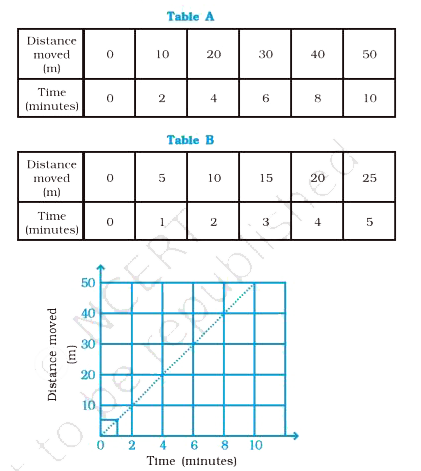
The graph given in Figure 13.2 is true for
A
both A and B.
B
A only.
C
B only.
D
neither A nor B.
Video Solution
Text Solution
The correct Answer is:A
For table A: we mark all the point of time and check what is the distance then we compare from the table. For the second table, we look for time in points given in the table and then draw a line cutting x-axis from that point and parallel to y-axis. This line cuts the dotted line at some point, this point is required a point to be plotted on the graph corresponding to point given in the table. Also, this point can be plotted with y-axis coordinate given in the table.
|
Updated on:21/07/2023
Topper's Solved these Questions
- BOOK - NCERT EXEMPLARCHAPTER - MOTION AND TIMEEXERCISE - SHORT ANSWER QUESTIONS5videos
MOTION AND TIME
- BOOK - NCERT EXEMPLARCHAPTER - MOTION AND TIMEEXERCISE - LONG ANSWER QUESTIONS3videos
MOTION AND TIME
- BOOK - NCERT EXEMPLARCHAPTER - LIGHT EXERCISE - LONG ANSWER QUESTIONS3videos
LIGHT
- BOOK - NCERT EXEMPLARCHAPTER - WIND, STORM AND CYCLONE EXERCISE - LONG ANSWER QUESTIONS3videos
WIND, STORM AND CYCLONE
Similar Questions
Knowledge Check
- Question 1 - Select One
The graph of distance -time graph for uniform motion for an object is
Astraight lineBcurved lineCfirst straight line then curved lineDNone of these - Question 2 - Select One
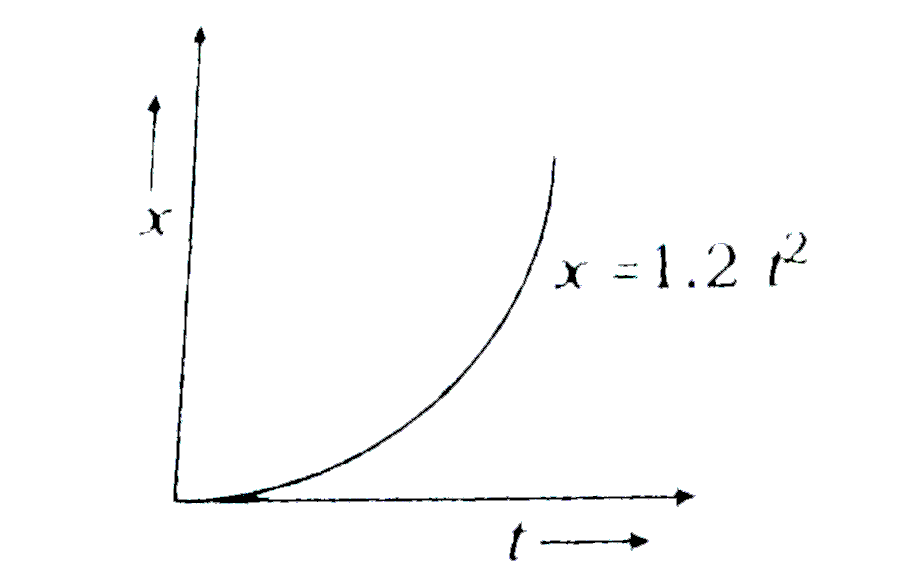
Look at the given distance -time graph of an object .
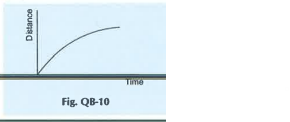 AThe speed of the object is increasing continuously.BThe speed of the object is decreasing continuously.CThe speed of the object is constant.DThe acceleration of the object is zero.
 - Question 3 - Select One
The distance-time graph of a moving vehicle is as shown in the figure.
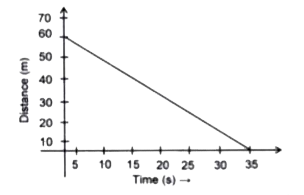 AThe speed of the vehicle is increasing with time.BThe speed of the vehicle is decreasing with time.CThe final speed of the vehicle is zero.DGraph is not possible.
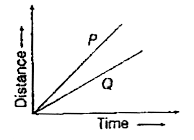
Figure shows that distance-time graph for the motion of two vechicles P and Q. which one of them is moving faster ?
 View Solution
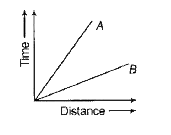
The distance - time graph for the motion of two vehicles . A and B is given below. Which one of the following statements is true ?
 View Solution
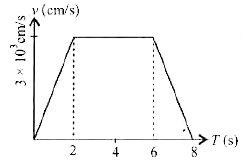
The velocity time graph of the motion of a car is given here.
 View Solution
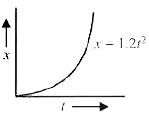
Given figure shows the distance-time graph of the motion of a car. It follows from the,| graph that the car is
 View Solution
Figure given shows the distance - time graph of the motion of a car. It follows from the graph that the car is
 View Solution

