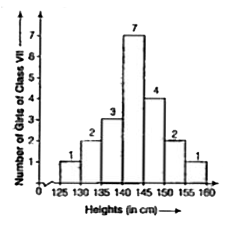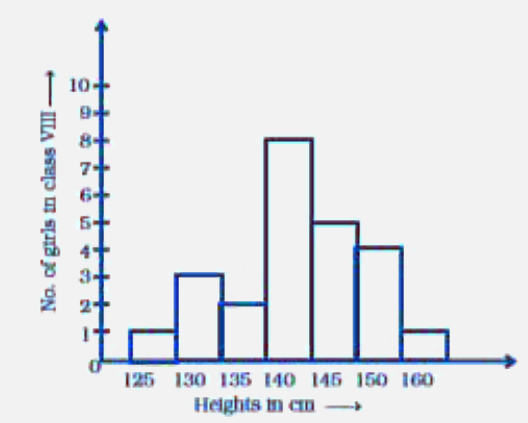
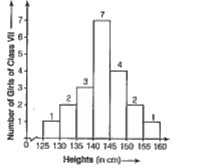
Observe the histogram given above. The number of girls having height 145 cm and above is
5
10
17
19
The correct Answer is:B
Step by step video & image solution for Observe the histogram given above. The number of girls having height 145 cm and above is by Maths experts to help you in doubts & scoring excellent marks in Class 8 exams.
Topper's Solved these Questions
- BOOK - NCERT EXEMPLARCHAPTER - DATA HANDLINGEXERCISE - THINK AND DISCUSS2videos
DATA HANDLING
- BOOK - NCERT EXEMPLARCHAPTER - DATA HANDLINGEXERCISE - EXERCISE (Choose the correct answer )35videos
DATA HANDLING
- BOOK - NCERT EXEMPLARCHAPTER - COMPARING QUANTITIESEXERCISE - Think and Discuss2videos
COMPARING QUANTITIES
- BOOK - NCERT EXEMPLARCHAPTER - DIRECT AND INVERSE PROPORTIONS EXERCISE - THINK AND DISCUSS2videos
DIRECT AND INVERSE PROPORTIONS
Similar Questions
Knowledge Check
- Question 1 - Select One
Observe the histogram and answer the questions given below.
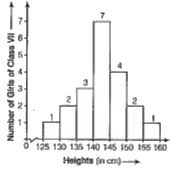
How many girls have a height of 145 cm and more?A6B7C5D2 - Question 2 - Select One
Study the table and answer the questions.
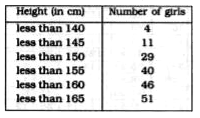
Average height (in cm) of the girls whose heights are 155cm and above is aboutA158.7B159.8C160.4D162.6 - Question 3 - Select One
Observe the bistogram and answer the questions given below
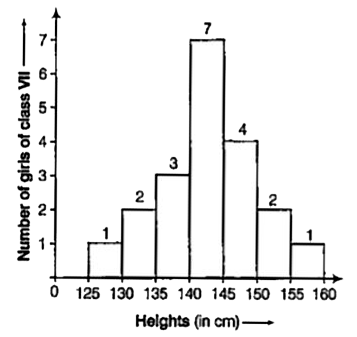
How many girls have a height of 145cm and more?A6B7C5D2
Study the table and answer the questions.
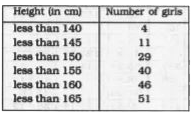
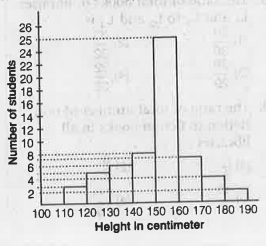
The number of girls whose height is above 150 cm isView SolutionFollowing histogram depicts the range of heights of students in a class of 60 students. Study the same and answer the questions.
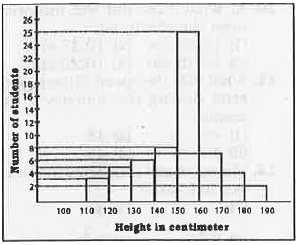
The number of students having height more than 150 cms isView SolutionFollowing histogram depicts the range of heights of students in a class of 60 students. Study the same and answer the questions.
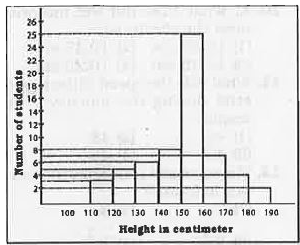
The number of students having their heights between 130 to 150 cms isView SolutionObserve the histogram and answer the questions given below.
Which group contains maximumView SolutionThe histogram, given below, shows the number of families of a locality having various daily incomes, as obtained by a survey. Observe the graph and answer the question based on it.
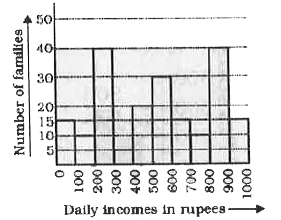
In all, how many families were surveyed ?View Solution


