The pie chart on the right shows the result of a survey carried out to find the modes of travel used by the children to go to school. Study the pie chart and answer the questions that follow.
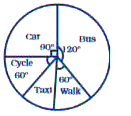
If 18 children travel by car, how many children took part in the survey?
Step by step video & image solution for The pie chart on the right shows the result of a survey carried out to find the modes of travel used by the children to go to school. Study the pie chart and answer the questions that follow. If 18 children travel by car, how many children took part in the survey? by Maths experts to help you in doubts & scoring excellent marks in Class 8 exams.
Updated on:21/07/2023Topper's Solved these Questions
- DATA HANDLINGBOOK - NCERT EXEMPLARCHAPTER - DATA HANDLINGEXERCISE - EXERCISE (True or False)
23 Videos
- COMPARING QUANTITIESBOOK - NCERT EXEMPLARCHAPTER - COMPARING QUANTITIESEXERCISE - Think and Discuss
2 Videos
- DIRECT AND INVERSE PROPORTIONS BOOK - NCERT EXEMPLARCHAPTER - DIRECT AND INVERSE PROPORTIONS EXERCISE - THINK AND DISCUSS
2 Videos
Similar Questions
The pie chart on the right shows the result of a survey carried out to find the modes of travel used by the children to go to school. Study the pie chart and answer the questions that follow.
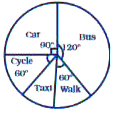
What fraction of children travel by car?
View SolutionThe pie chart on the right shows the result of a survey carried out to find the modes of travel used by the children to go to school. Study the pie chart and answer the questions that follow.
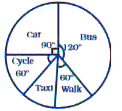
If 18 children travel by car, How many children use taxi to travel to school?
View Solution
Knowledge Check
The following graph represents the transport used by children. Study the graph and answer the given questions.
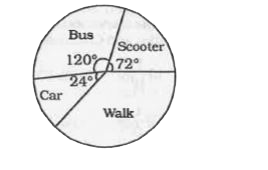
If 10 students come by car, how many come by bus ?A60B50C30D100The pie chart shows the results of an online survey which asked people about their favourite author. Study the diagram and answer the following questions.
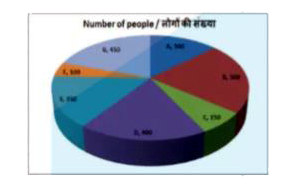
What is the total number of people who have responded to the survey ?A2250B2100C2400D2000The pie chart shows the results of an online survey which asked people about their favourite author. Study the diagram and answer he following questions.
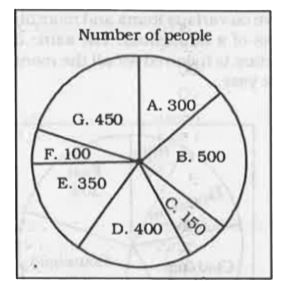
Which author is the favourite of most people surveyed?AFBBCDDE
The pie chart on the right shows the result of a survey carried out to find the modes of travel used by the children to go to school. Study the pie chart and answer the questions that follow.
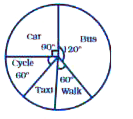
What is the most common mode of transport?
View SolutionThe pie chart on the right shows the result of a survey carried out to find the modes of travel used by the children to go to school. Study the pie chart and answer the questions that follow.
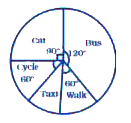
By which two modes of transport are equal number of children travelling?
View SolutionThe Pie-chart shows the result of a survey among 119060 people concerning the use of tobacco. Study the Pie-chart and answer the questions.
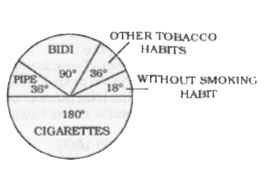
The number of people preferring Bidi is :
View SolutionThe Pie-chart shows the result of a survey among 119060 people concerning the use of tobacco. Study the Pie-chart and answer the questions.
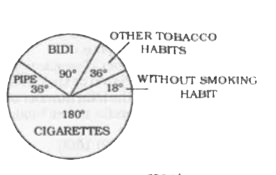
The number of people smoking Cigarettes is :
View SolutionThe pie chart shows the results of an online survey which asked people about their favourite author. Study the diagram and answer he following questions.

Which author is the favourite of most people surveyed?
View Solution
