In a histogram, class intervals and frequencies are taken along _______axis and _______axis.
To answer the question about the axes in a histogram, we can follow these steps:
1. Understanding the Histogram: A histogram is a graphical representation of data using bars of different heights. Each bar represents the frequency of data within a certain range (class interval).
2. Identify the Axes: In a histogram:
- The x-axis (horizontal axis) represents the class intervals. These are the ranges of data that are grouped together.
- The y-axis (vertical axis) represents the frequencies. This indicates how many data points fall within each class interval.
3. Conclusion: Therefore, in a histogram, class intervals are taken along the x-axis and frequencies are taken along the y-axis.
Final Answer:
In a histogram, class intervals and frequencies are taken along x-axis and y-axis.
---
- The x-axis (horizontal axis) represents the class intervals. These are the ranges of data that are grouped together.
- The y-axis (vertical axis) represents the frequencies. This indicates how many data points fall within each class interval.
In a histogram, class intervals and frequencies are taken along x-axis and y-axis.
Topper's Solved these Questions
- DATA HANDLINGBOOK - NCERT EXEMPLARCHAPTER - DATA HANDLINGEXERCISE - EXERCISE (True or False)
23 Videos
- DATA HANDLINGBOOK - NCERT EXEMPLARCHAPTER - DATA HANDLINGEXERCISE - EXERCISE
73 Videos
- DATA HANDLINGBOOK - NCERT EXEMPLARCHAPTER - DATA HANDLINGEXERCISE - EXERCISE (Choose the correct answer )
35 Videos
- COMPARING QUANTITIESBOOK - NCERT EXEMPLARCHAPTER - COMPARING QUANTITIESEXERCISE - Think and Discuss
2 Videos
- DIRECT AND INVERSE PROPORTIONS BOOK - NCERT EXEMPLARCHAPTER - DIRECT AND INVERSE PROPORTIONS EXERCISE - THINK AND DISCUSS
2 Videos
Similar Questions
Knowledge Check
In a histogram each class rectangle is constructed with base as
AfrequencyBclass intervalsCrangeDsize of classTo draw a frequency polygon we need ______of the class interval of x-axis and frequency of the respective class for y-axis.
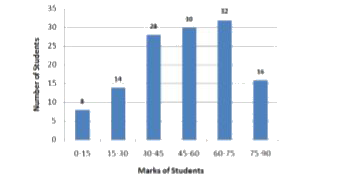
Aupper limitBlower limitCclass-markDrangeIn the given histogram, in which class interval, the median marks lies?
 A30−45B45−60C60−75D15−30
In velocity-time graph, velocity is taken on ___________ axis
View SolutionWhen we take class intervals on the x-axis and corresponding frequencies on the y-axis, and draw rectangles with the areas proportional to the frequencies of the respective class intervals, the graph so obtained is called
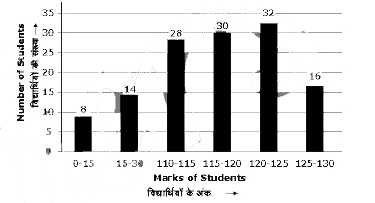
View SolutionIn the given histogram , in which class interval the median marks lies?

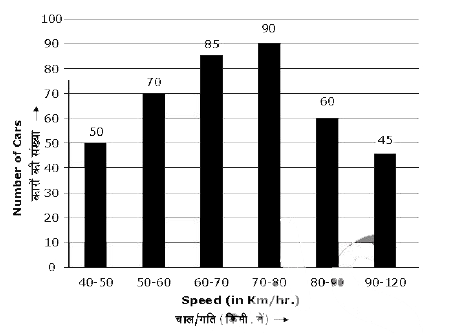
View SolutionConstruct a histogram for the following frequency distribution :

View SolutionIn the given histogram, in which class interval, the median marks lies?

View Solution

