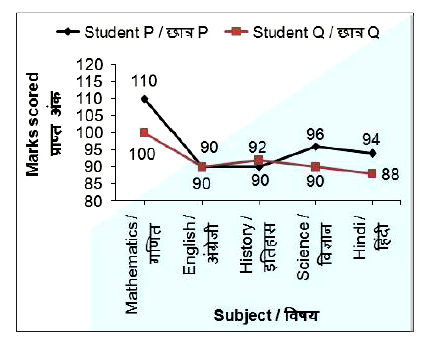
Study the pie chart given below depicting the marks scored by a student in an examination out of 540. Find the marks obtained by him in each subject.
Step by step video & image solution for Study the pie chart given below depicting the marks scored by a student in an examination out of 540. Find the marks obtained by him in each subject. by Maths experts to help you in doubts & scoring excellent marks in Class 8 exams.
Updated on:21/07/2023Topper's Solved these Questions
- DATA HANDLINGBOOK - NCERT EXEMPLARCHAPTER - DATA HANDLINGEXERCISE - EXERCISE (True or False)
23 Videos
- COMPARING QUANTITIESBOOK - NCERT EXEMPLARCHAPTER - COMPARING QUANTITIESEXERCISE - Think and Discuss
2 Videos
- DIRECT AND INVERSE PROPORTIONS BOOK - NCERT EXEMPLARCHAPTER - DIRECT AND INVERSE PROPORTIONS EXERCISE - THINK AND DISCUSS
2 Videos
Similar Questions
Knowledge Check
The given pie-chart shows the marks obtained (in degrees) by a student in different subjects. The total marks obtained by the student in the examination is 432.
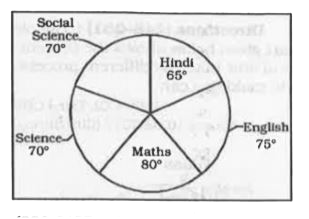
The marks obtained in Maths is how much per cent more than the marks obtained in Social Science?A7.14B14.28C9.13D10.41The given pie-chart shows the marks obtained (in degrees) by a student in different subjects. The total marks obtained by the student in the examination is 432.
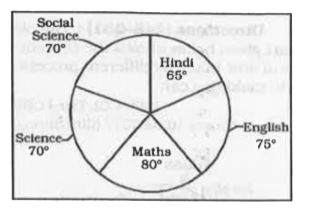
The marks obtained in Science in what percentage of the total marks?A20.14B18.12C17.16D19.44The given pie-chart shows the marks obtained (in degrees) by a student in different subjects. The total marks obtained by the student in the examination is 432.

The marks obtained in Maths is how much per cent more than the marks obtained in Social Science?A7.14B14.28C9.13D10.41
The line chart given below shows the marks scored by 2 students P and Q in five subjects.
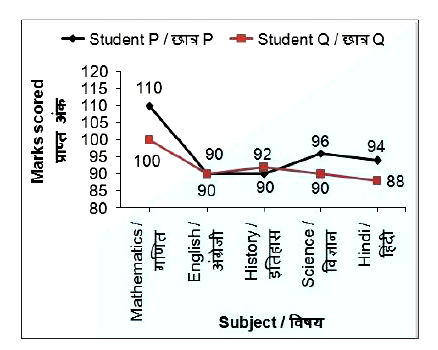
What is the ratio of the marks scored by student P in Science to the marks scored by student Q in History?
View SolutionThe marks obtained by a student in an examination are given below :

Represent the data using a pie diagram.
View SolutionThe given pie chart shows the marks obtained (in degrees) by a student in different subjects . The total marks obtained by the student in the examination is 432.
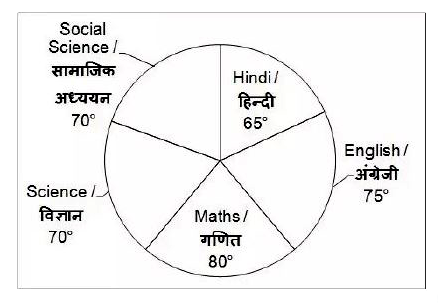
The marks obtained in Maths is how much percent more than the marks obtained in Science?
View SolutionThe marks obtained by a student in an examination are given below:

Represent the data using pie diagram.
View SolutionThe marks obtained by a student in an examination are given below:

Represent the data using pie diagram
View Solution


