A graph that displays data that changes continuously over periods of time is
bar graph
pie chart
histogram
line graph
The correct Answer is:D
Step by step video & image solution for A graph that displays data that changes continuously over periods of time is by Maths experts to help you in doubts & scoring excellent marks in Class 8 exams.
Updated on:21/07/2023Topper's Solved these Questions
- INTRODUCTION TO GRAPHS BOOK - NCERT EXEMPLARCHAPTER - INTRODUCTION TO GRAPHS EXERCISE - THINK AND DISCUSS
4 Videos
- EXPONENTS AND POWERSBOOK - NCERT EXEMPLARCHAPTER - EXPONENTS AND POWERSEXERCISE - EXERCISE
195 Videos
- LINEAR EQUATIONS IN ONE VARIABLEBOOK - NCERT EXEMPLARCHAPTER - LINEAR EQUATIONS IN ONE VARIABLEEXERCISE - THINK AND DISCUSS
3 Videos
Similar Questions
"The role of accounting has changed over the period of time " Explain.
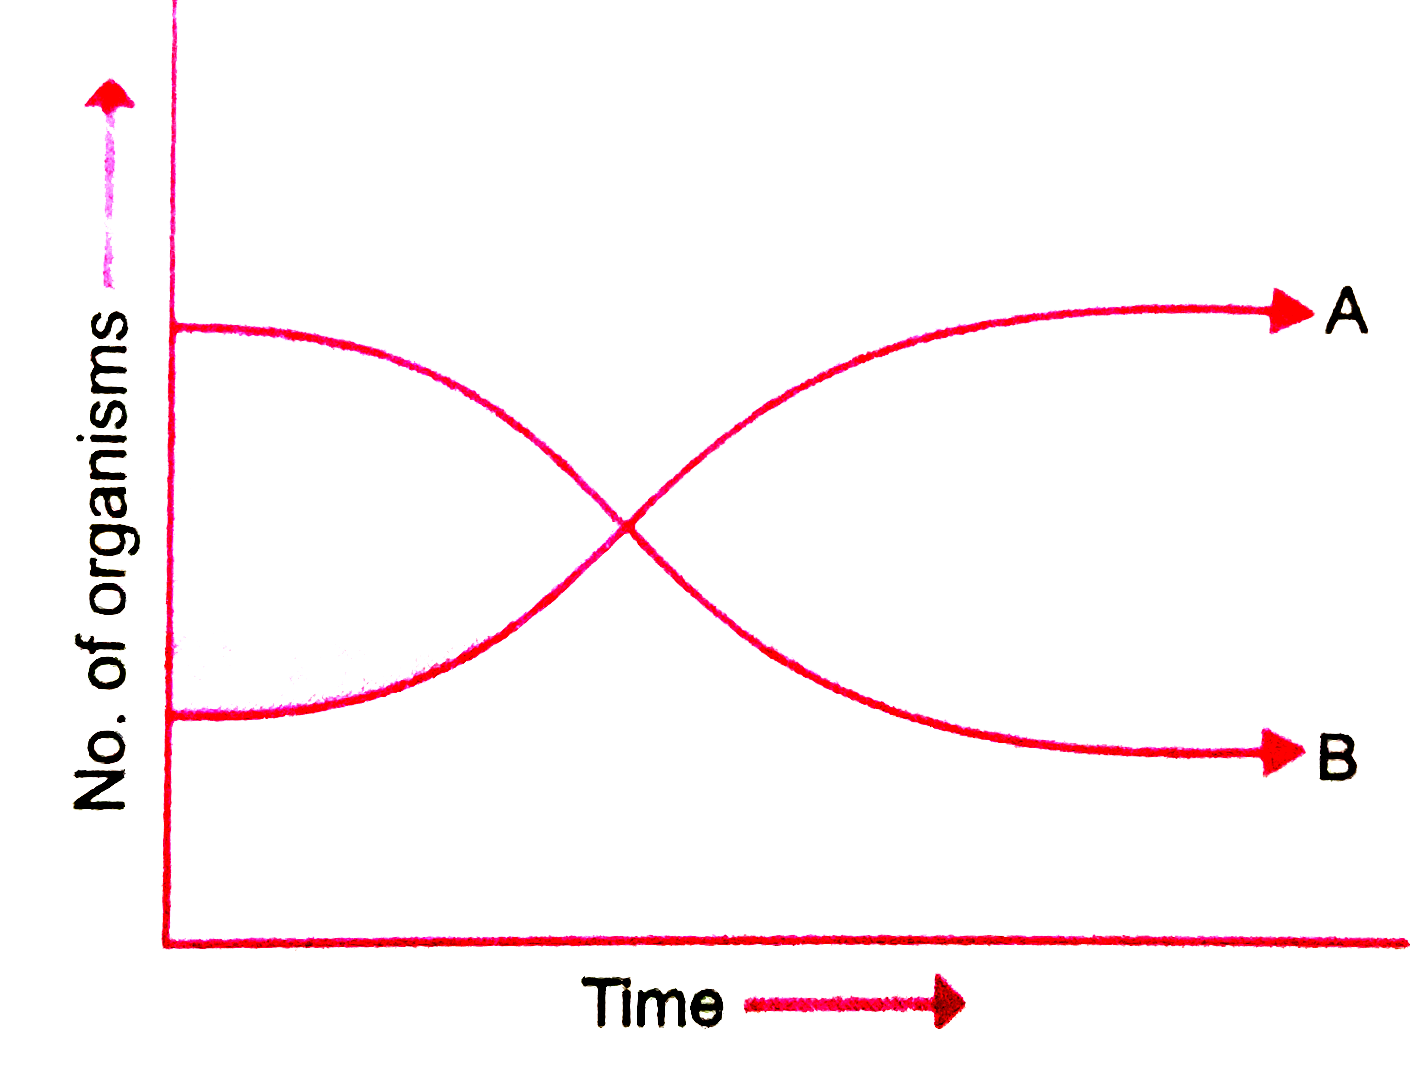
View Solution(a) The graph below represents the growth patterns of types of aquatic organisms over a brief period of time in a water body surrounded by an agricultural land extensively supplied with fertilizers. Identify what would represent (i) A and (ii) B
(b) State the reason for such a change in the water body and also write the term given to it.

View Solution
Knowledge Check
The amount multiplies over a period of time.
AwithinBinCbyDNo ImprovementThe concept that species have changed over long periods of time is known as
AecologyBembryologyCspontaneous generationDorganic evolutionA simple pendulum has some time period T. What will be the percentage change in its time period if its amplitude is decreased by 5%
A6%B3%C1.5%D0%
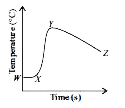
Excess of sodium hydroxide pellets are added to dilute hydrochloric acid and the temperature change of the mixture was measured over a period of time. The given graph shows the temperature change Time (s) with time.
What can be inferred from the graph?

View SolutionA simple pendulum has some time period T. What will be the percentage change in its time period if its amplitude is decreased by 5%
View SolutionThe classification system have undergone several changes over a period of time, why?
View SolutionAssertion: Classification systems have undergoes several changes over a period of time.
Reason: This happened, because the criteria for classification get changed gradually.
View SolutionA simple pendulum has some time period T. What will be the % change in its time-period if its amplitude is decreased by 6%
View Solution
