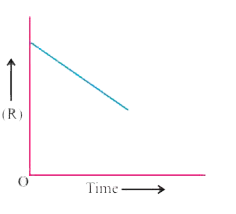
Consider the reaction, Ak−−→B. The change in concentration with time t is shown in the graph below

Find the slope of the curve.Solution in Odia
Step by step video & image solution for Consider the reaction, A overset(k) (to) B. The change in concentration with time t is shown in the graph below Find the slope of the curve. by Chemistry experts to help you in doubts & scoring excellent marks in Class 12 exams.
Updated on:21/07/2023Topper's Solved these Questions
- CHEMICAL KINETICSBOOK - ARIHANT PUBLICATIONCHAPTER - CHEMICAL KINETICSEXERCISE - CHAPTER PRACTICE (Short Answer Type II Questions)
8 Videos
- CARBOXYLIC ACIDS BOOK - ARIHANT PUBLICATIONCHAPTER - CARBOXYLIC ACIDS EXERCISE - CHAPTER PRACTICE (LONG ANSWER TYPE QUESTIONS)
3 Videos
- CHEMISTRY IN EVERYDAY LIFE BOOK - ARIHANT PUBLICATIONCHAPTER - CHEMISTRY IN EVERYDAY LIFE EXERCISE - CHAPTER PRACTICE (LONG ANSWER TYPE QUESTIONS)
2 Videos
Similar Questions
Half-life of a first order reaction is 8×10⁴ s. What percentage of the initial reactant will react in 2 h?
View SolutionConvert
(a) the benzoic acid to benzaldehyde
(b) the propanone to propane
View Solution(a) With the help of an example explain how do tranquilizers act as antidepressants?
View SolutionConsider the given graph: Graph is plotted for 1 mol of gas at 400K, find slope of curve [take: R = 0.08(L-atm)/(mol-K)]
View Solutionकिसी अभिक्रिया के लिए निम्न तथ्यों के आधार पर अभिक्रिया की कोटि ज्ञात कीजिए
(a) 1Cvs समय के वक्र को प्रवणता K होने पर
(b) Cvs समय के वक्र को प्रवणता (-K) होने पर
(c ) logCvs समय के वक्र को प्रवणता [−K2.303] होने पर
View SolutionWhat is slope of the graph of log[A] vs t for a first order reaction, where [A] is the concentration of reactant at any time t during the reaction.
View SolutionTwo plots are shown below between concentration and time t. Which of the given orders are shown by the graph respectively?
View SolutionFor a chemical reaction R → P, the variation in the concentration (R) vs time (t) plot is given :

What is the slope of the curve ?
View SolutionTwo plots are shown below between concentration and time t. Which of the given orders are shown by the graphs respectively?

View Solutionदो प्लॉट सान्द्रण एवं समय t के मध्य नीचे दर्शाए गये हैं। निम्न में से कौन-सी कोटियाँ क्रमशः ग्राफ द्वारा दर्शाई गई हैं।

View SolutionDraw the graph for [R] versus time (t) for a zero order reaction. Give the relationship between the rate constant and the slope of the curve.
View SolutionTwo plots are shown below between concentration and time t. Which of the given orders are shown by the graph respectively?
View SolutionRate of a reaction is the change in concentration of reactant or product per unit time.what does the slope of the graph represent, variation In the concentration vs time for a zero order reaction?
View SolutionConsider the reaction, A overset(k) (to) B . The change in concentration with time t is shown in the graph below Predict the order of the reaction.
View SolutionConsider the reaction, Ak−−→B. The change in concentration with time t is shown in the graph below

Derive the expression for the time which is required to complete the reaction.
View Solution
