Two plots are shown below between concentration and time t. Which of the given orders are shown by the graph respectively?
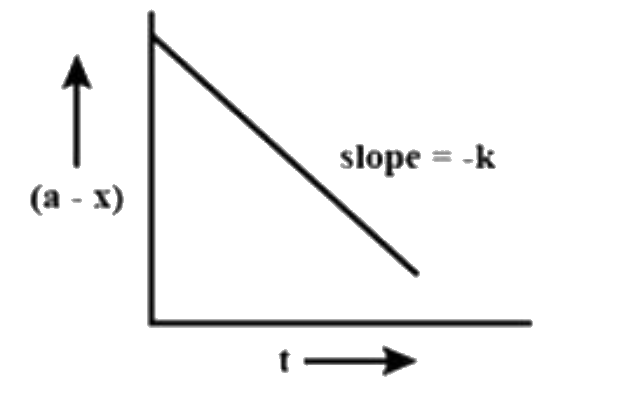
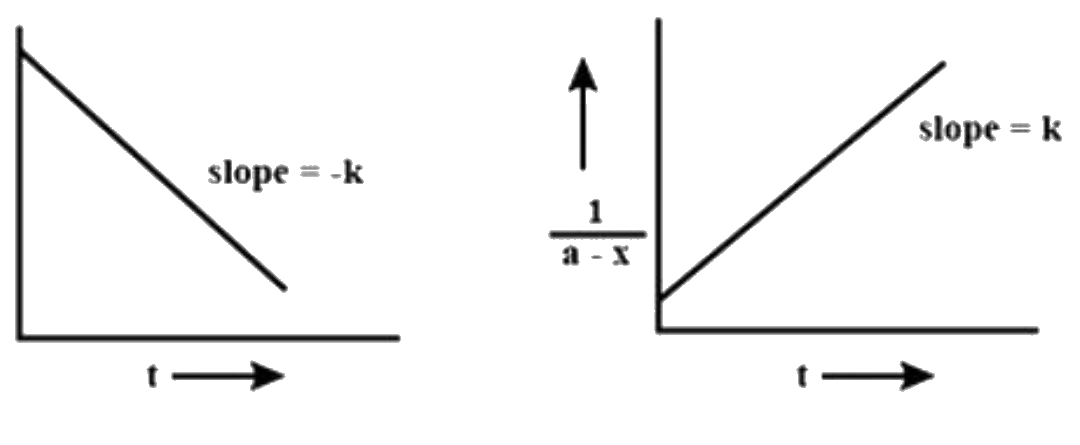
Zero order and first order
First order and second order
Zero order and second order
First order and first order
The correct Answer is:C
Step by step video & image solution for Two plots are shown below between concentration and time t. Which of the given orders are shown by the graph respectively? by Chemistry experts to help you in doubts & scoring excellent marks in Class 12 exams.
Updated on:21/07/2023Similar Questions
Two plots are shown below between concentration and time t. Which of the given orders are shown by the graphs respectively?

View SolutionObserve the given graphs carefully.
Which of the given orders are shown by the graphs respectively?
View SolutionThe graph plotted between concentration versus time
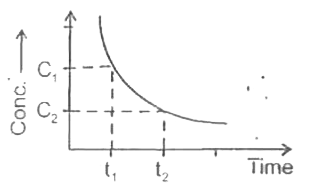
View SolutionFor a reaction , a graph was plotted between reactant concentration c and time as shown in the figure below.
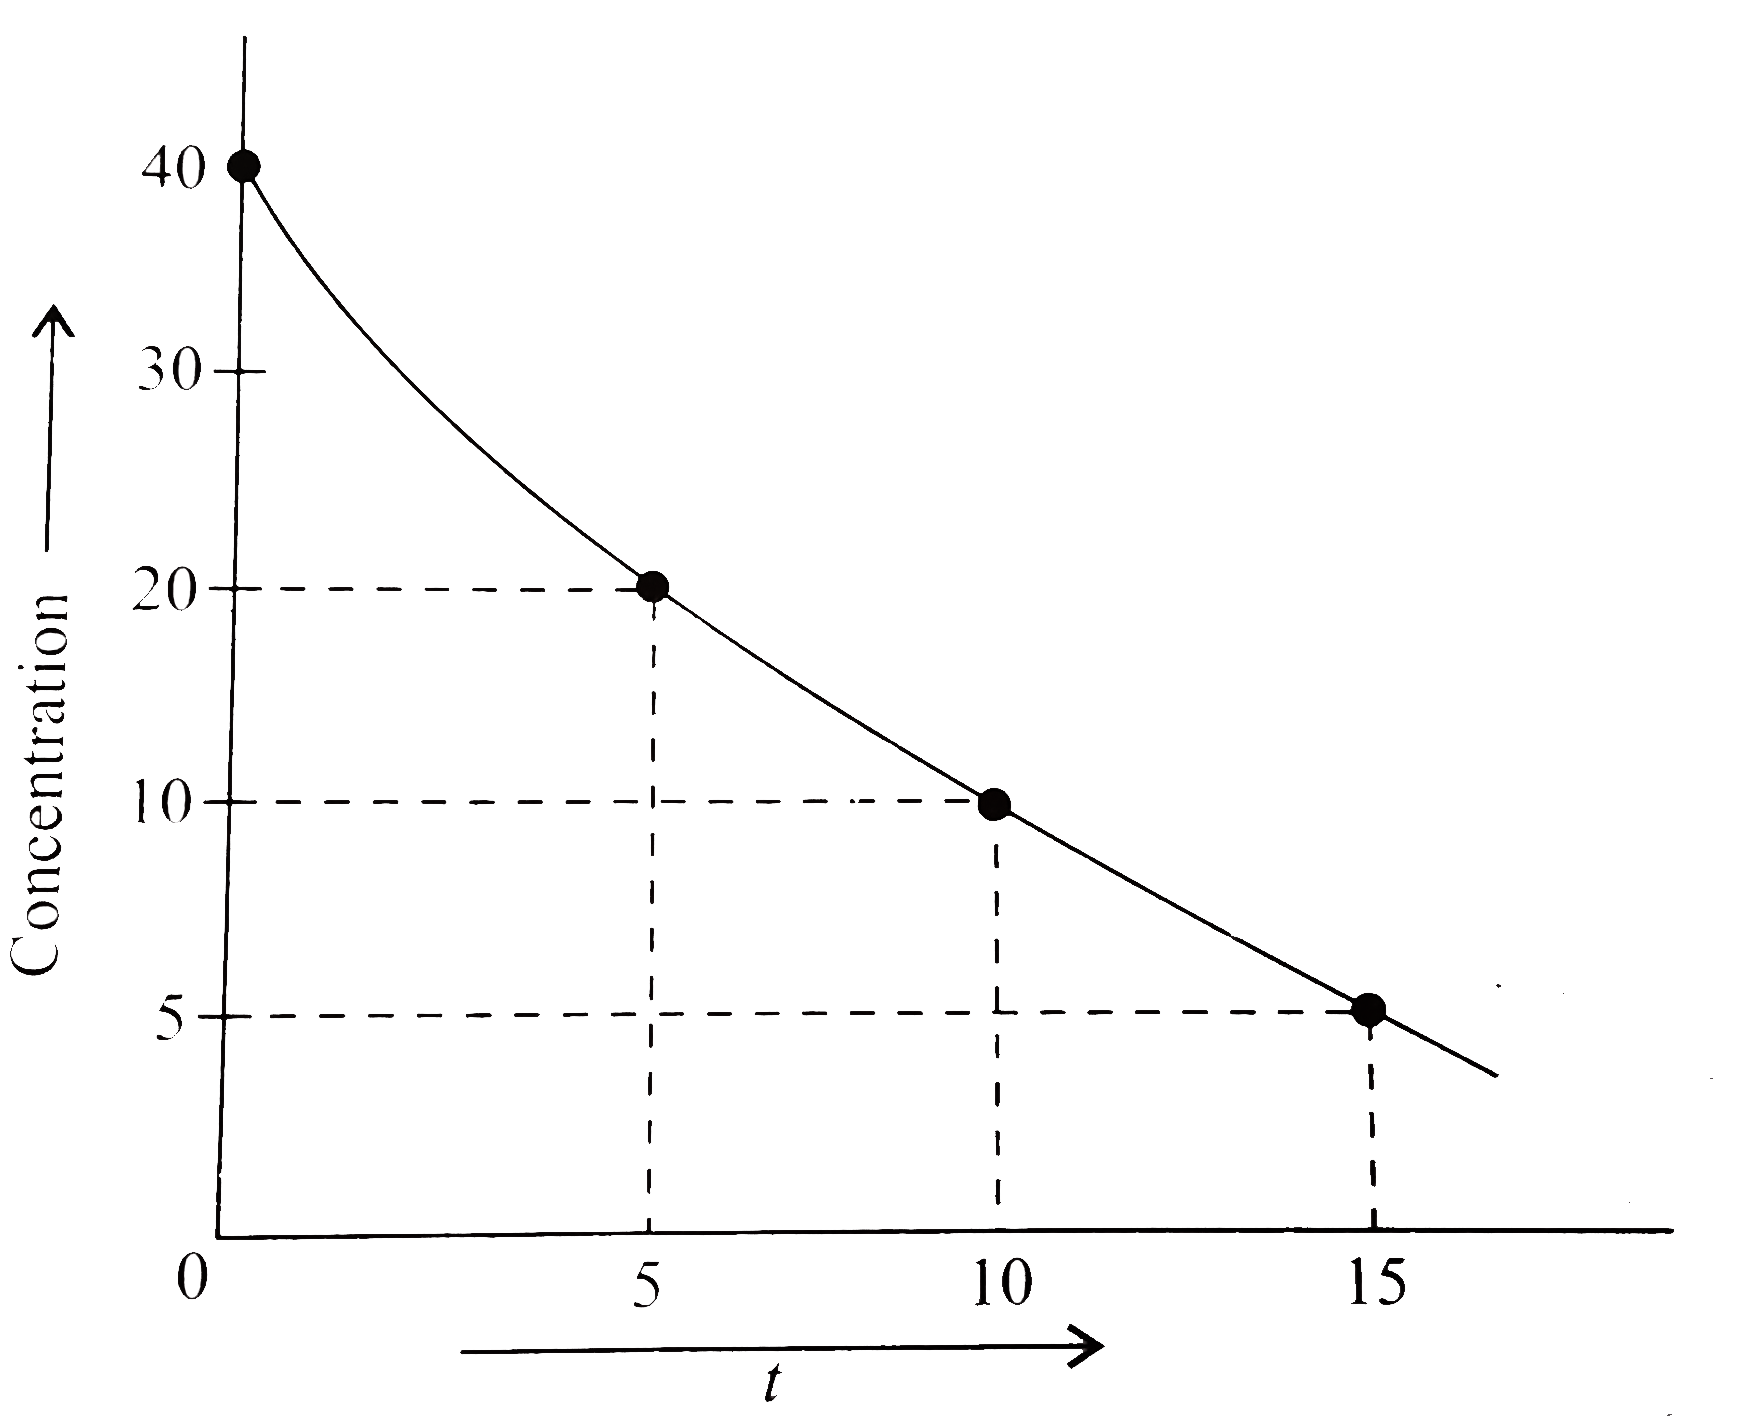
Identify the order of the reaction with respect to the reactant. Can the concentration of the reactant be theoretically zero after infinite time?
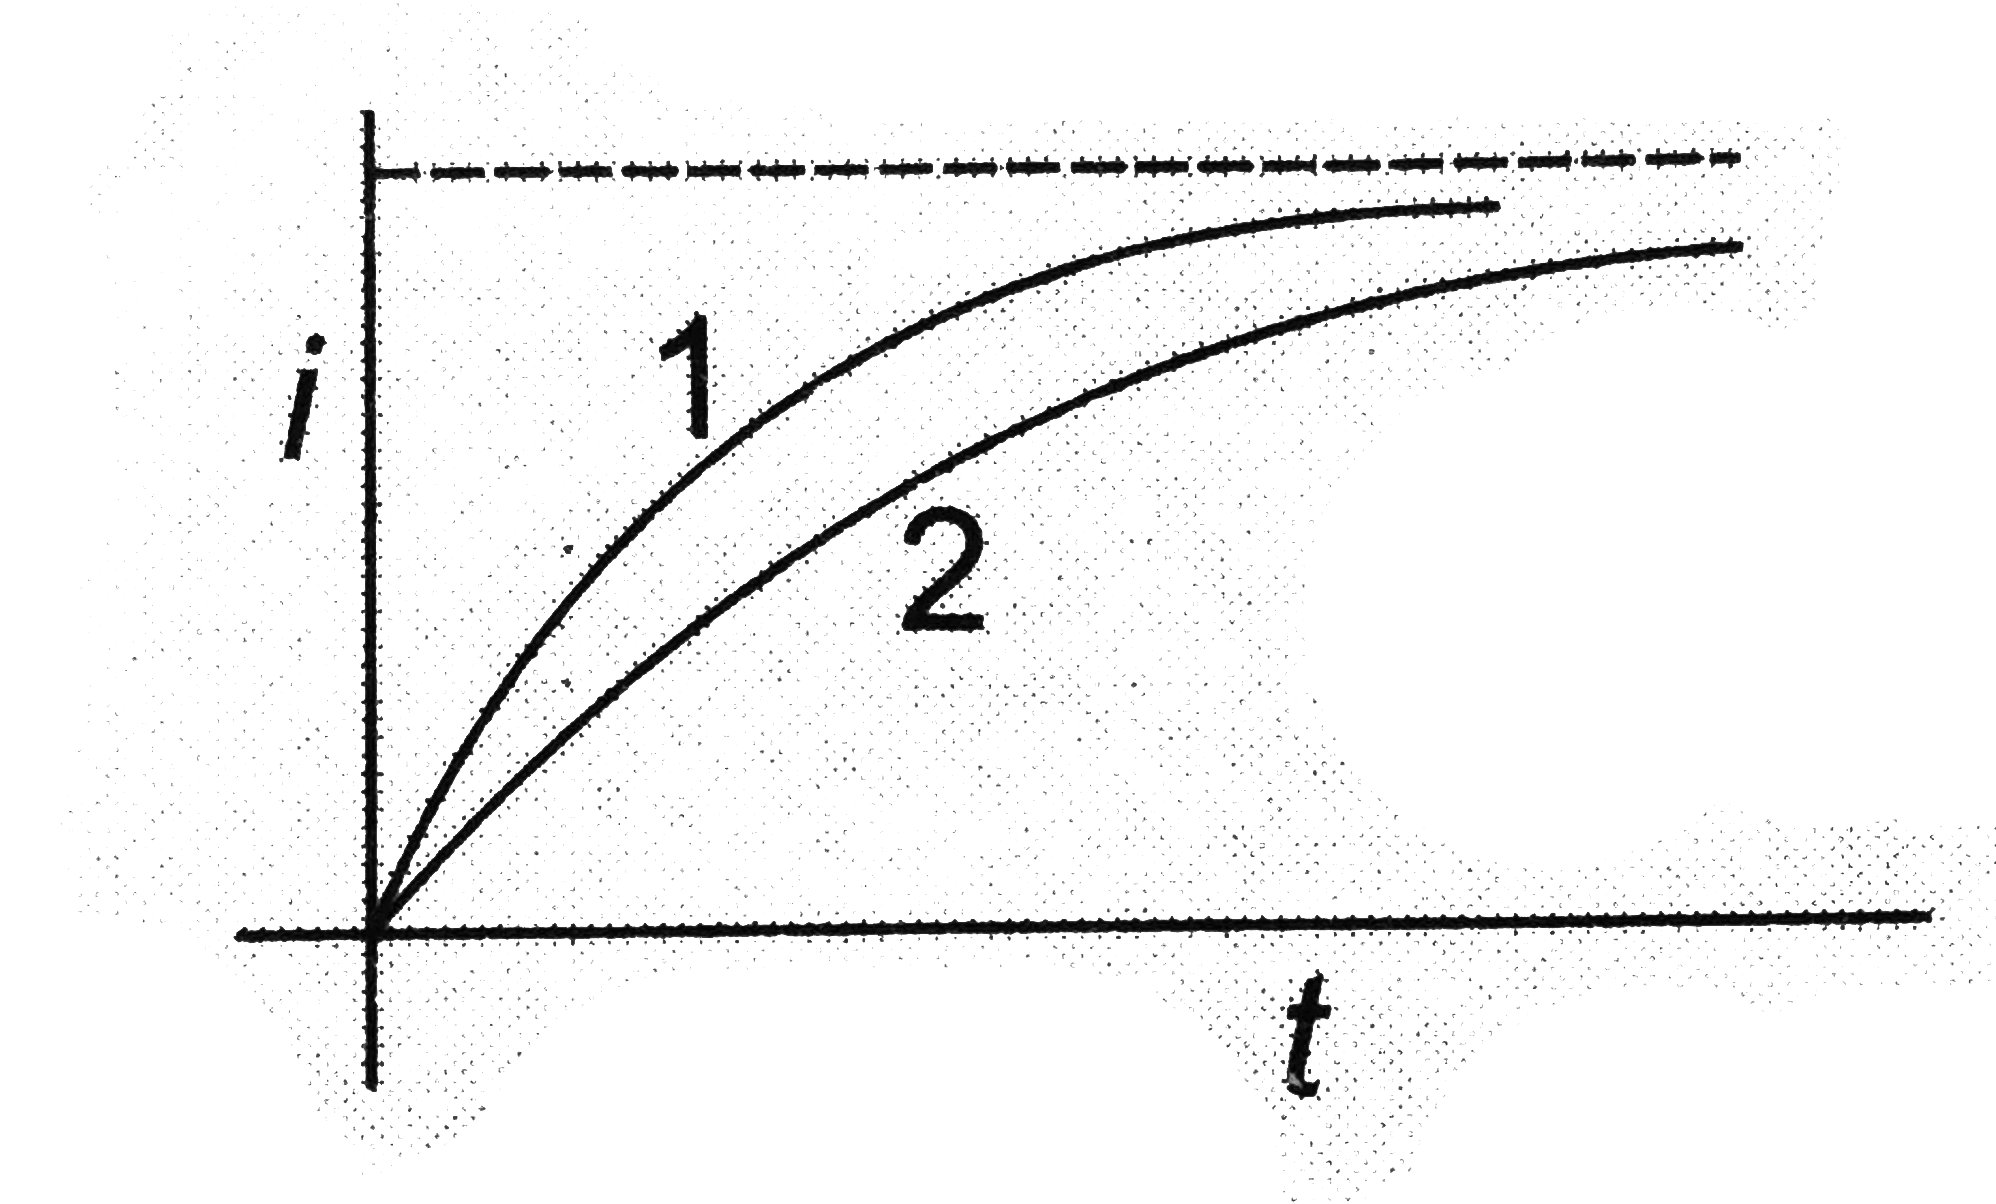
View SolutionWhich of the two curves shown below has lesser time constant.
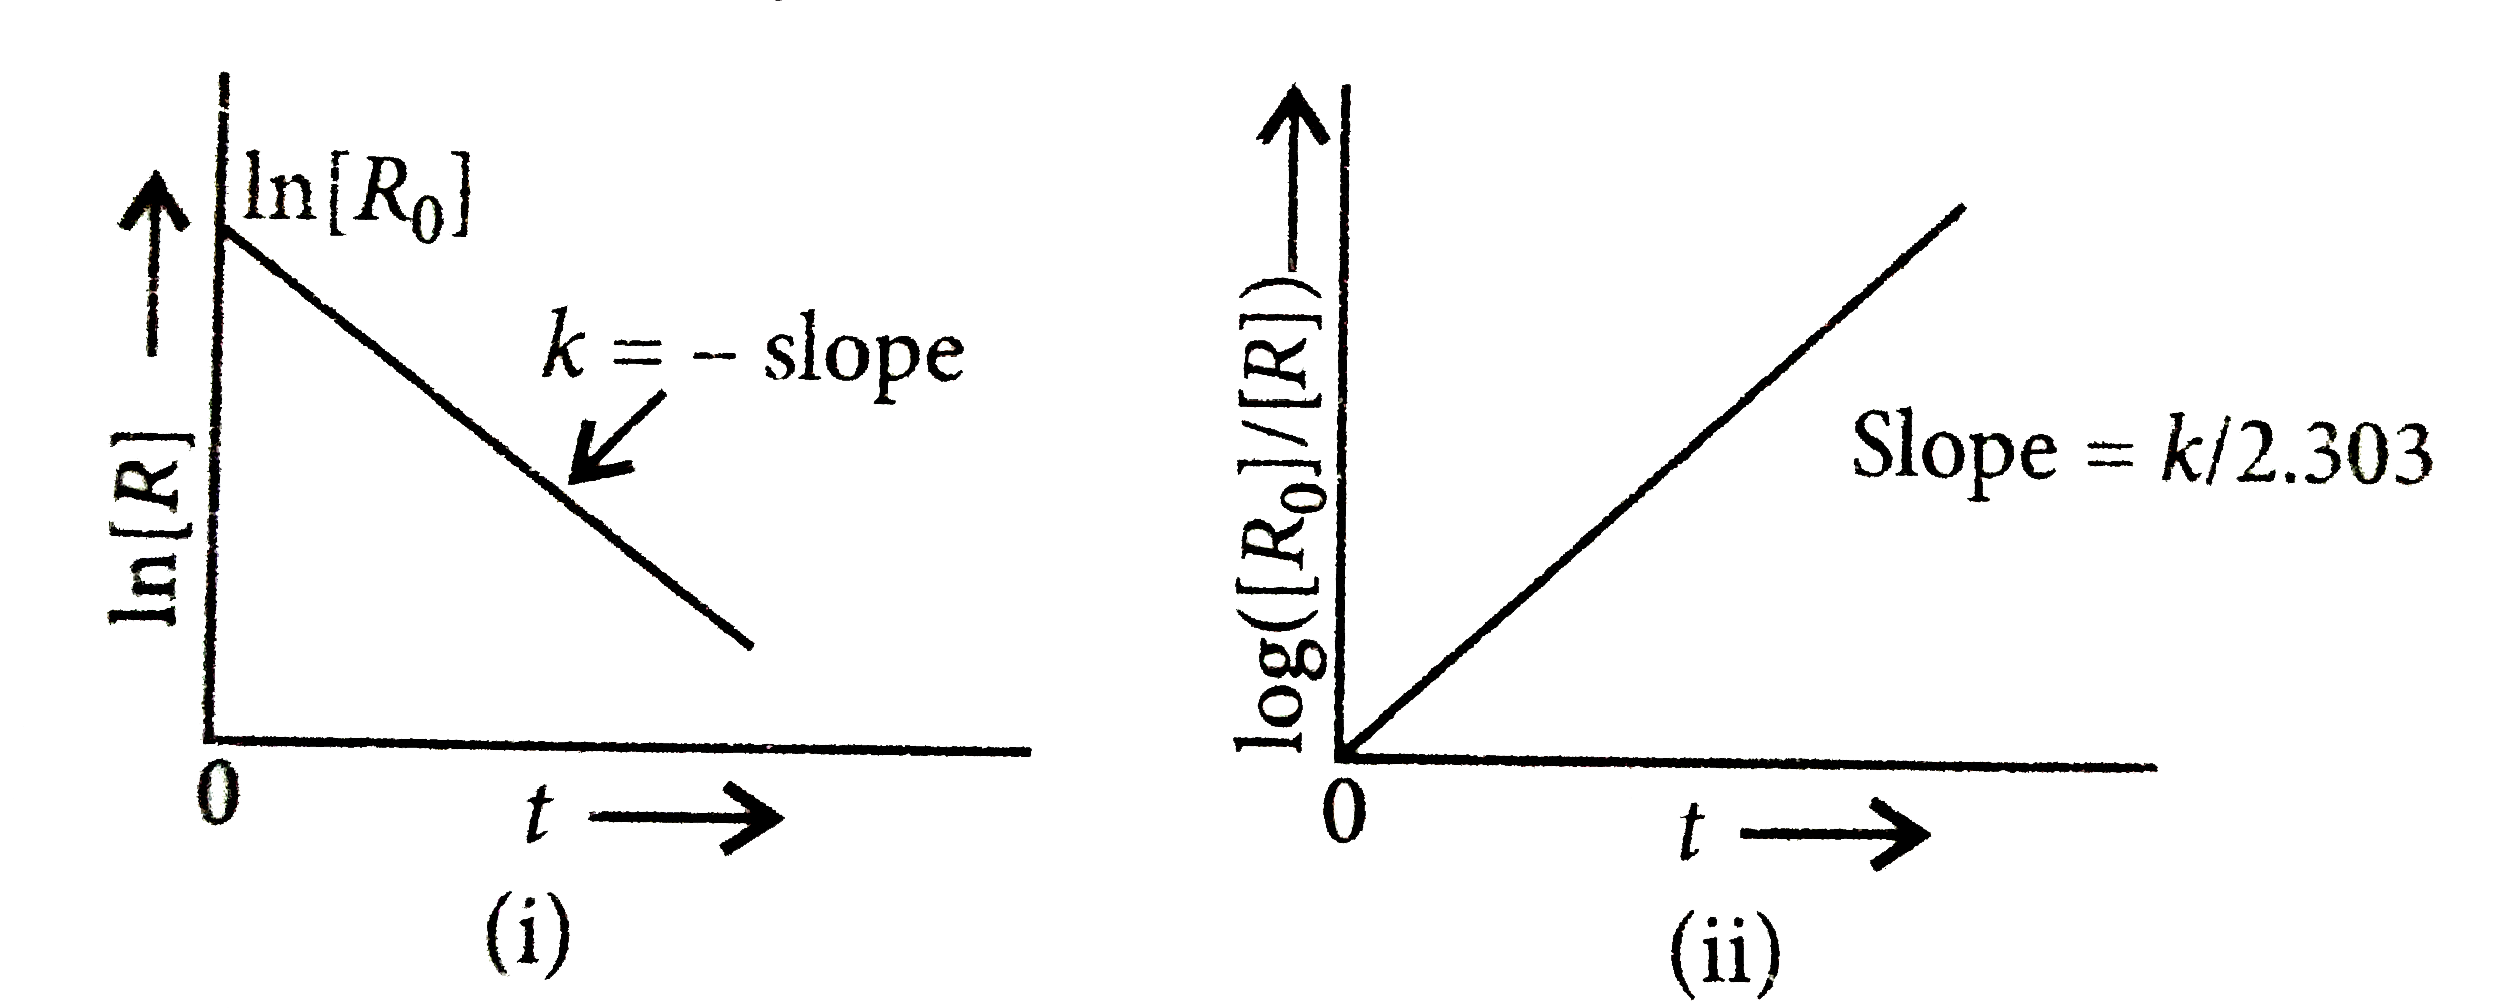
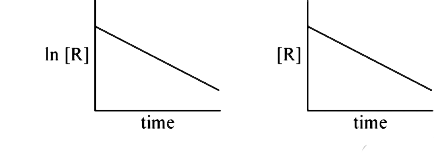
View SolutionThe given plots represent the variation of the concentration of a reactant R with time for different reactions (i) and (ii). The respective orders of the reactions are:
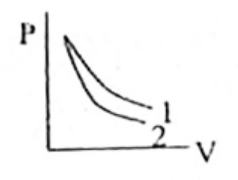
View SolutionP.V plots for two gases during adiabatic processes are shown in the figure Plots 1 and 2 should correspond respectively to
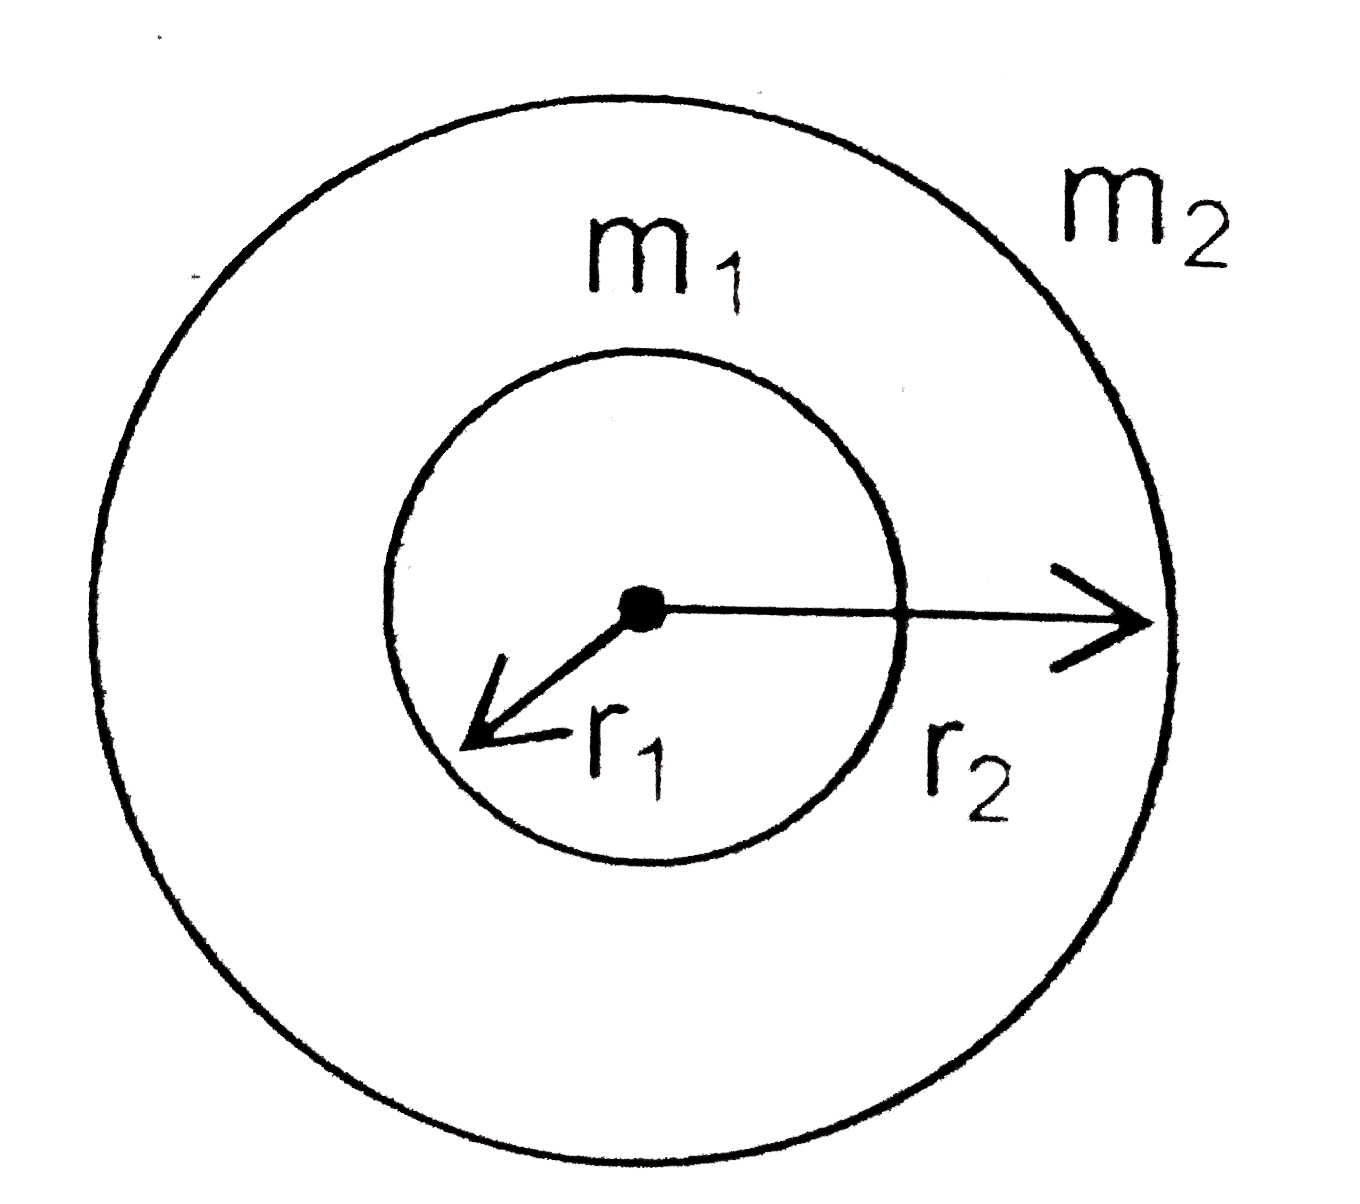
View SolutionTwo concentric spherical sheels are as shown in figure. The V−r graph will be as
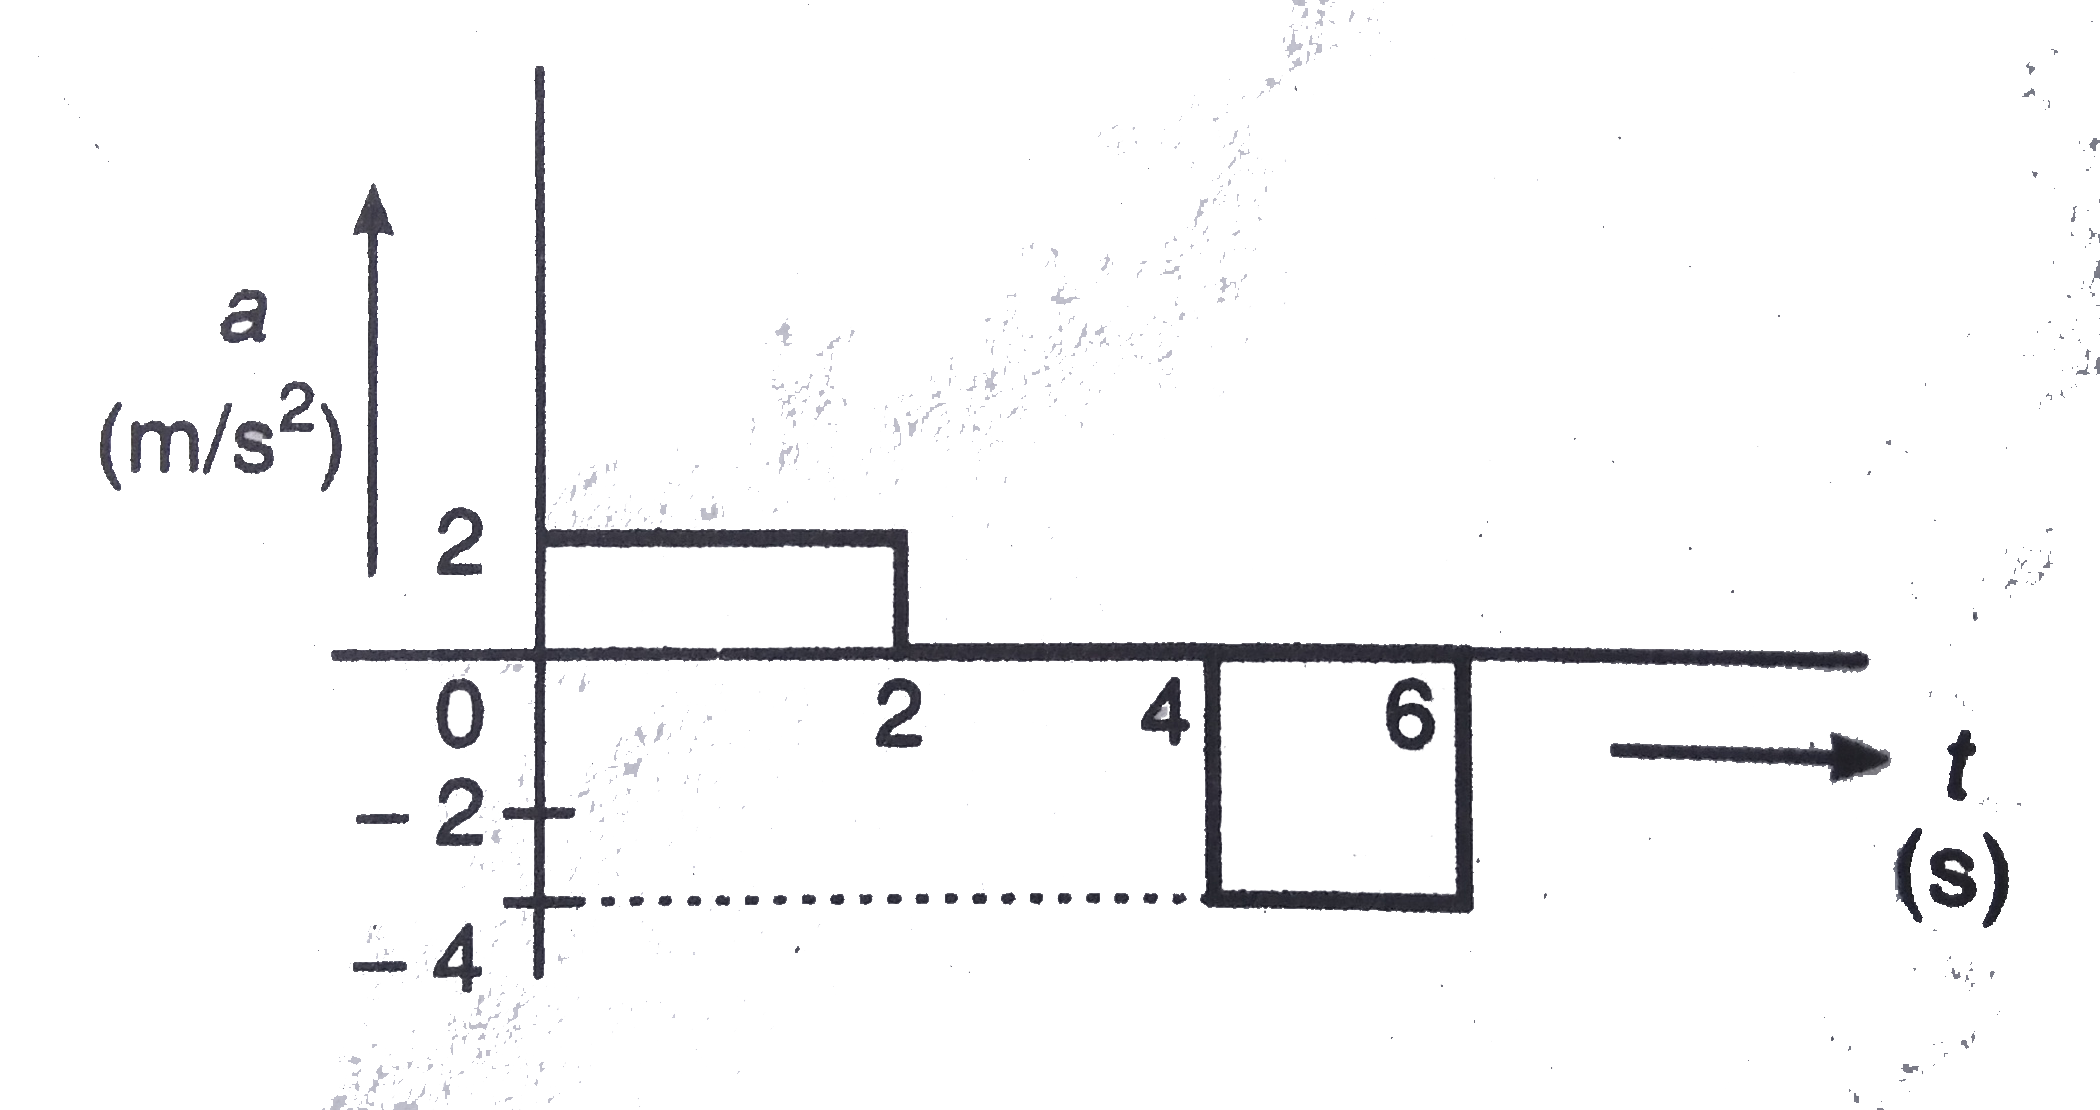
View SolutionThe acceleration versus time graph of a particle moving along a straight line is shown in the figure. Draw the respective velocity-time graph Given v=0 at t=0.
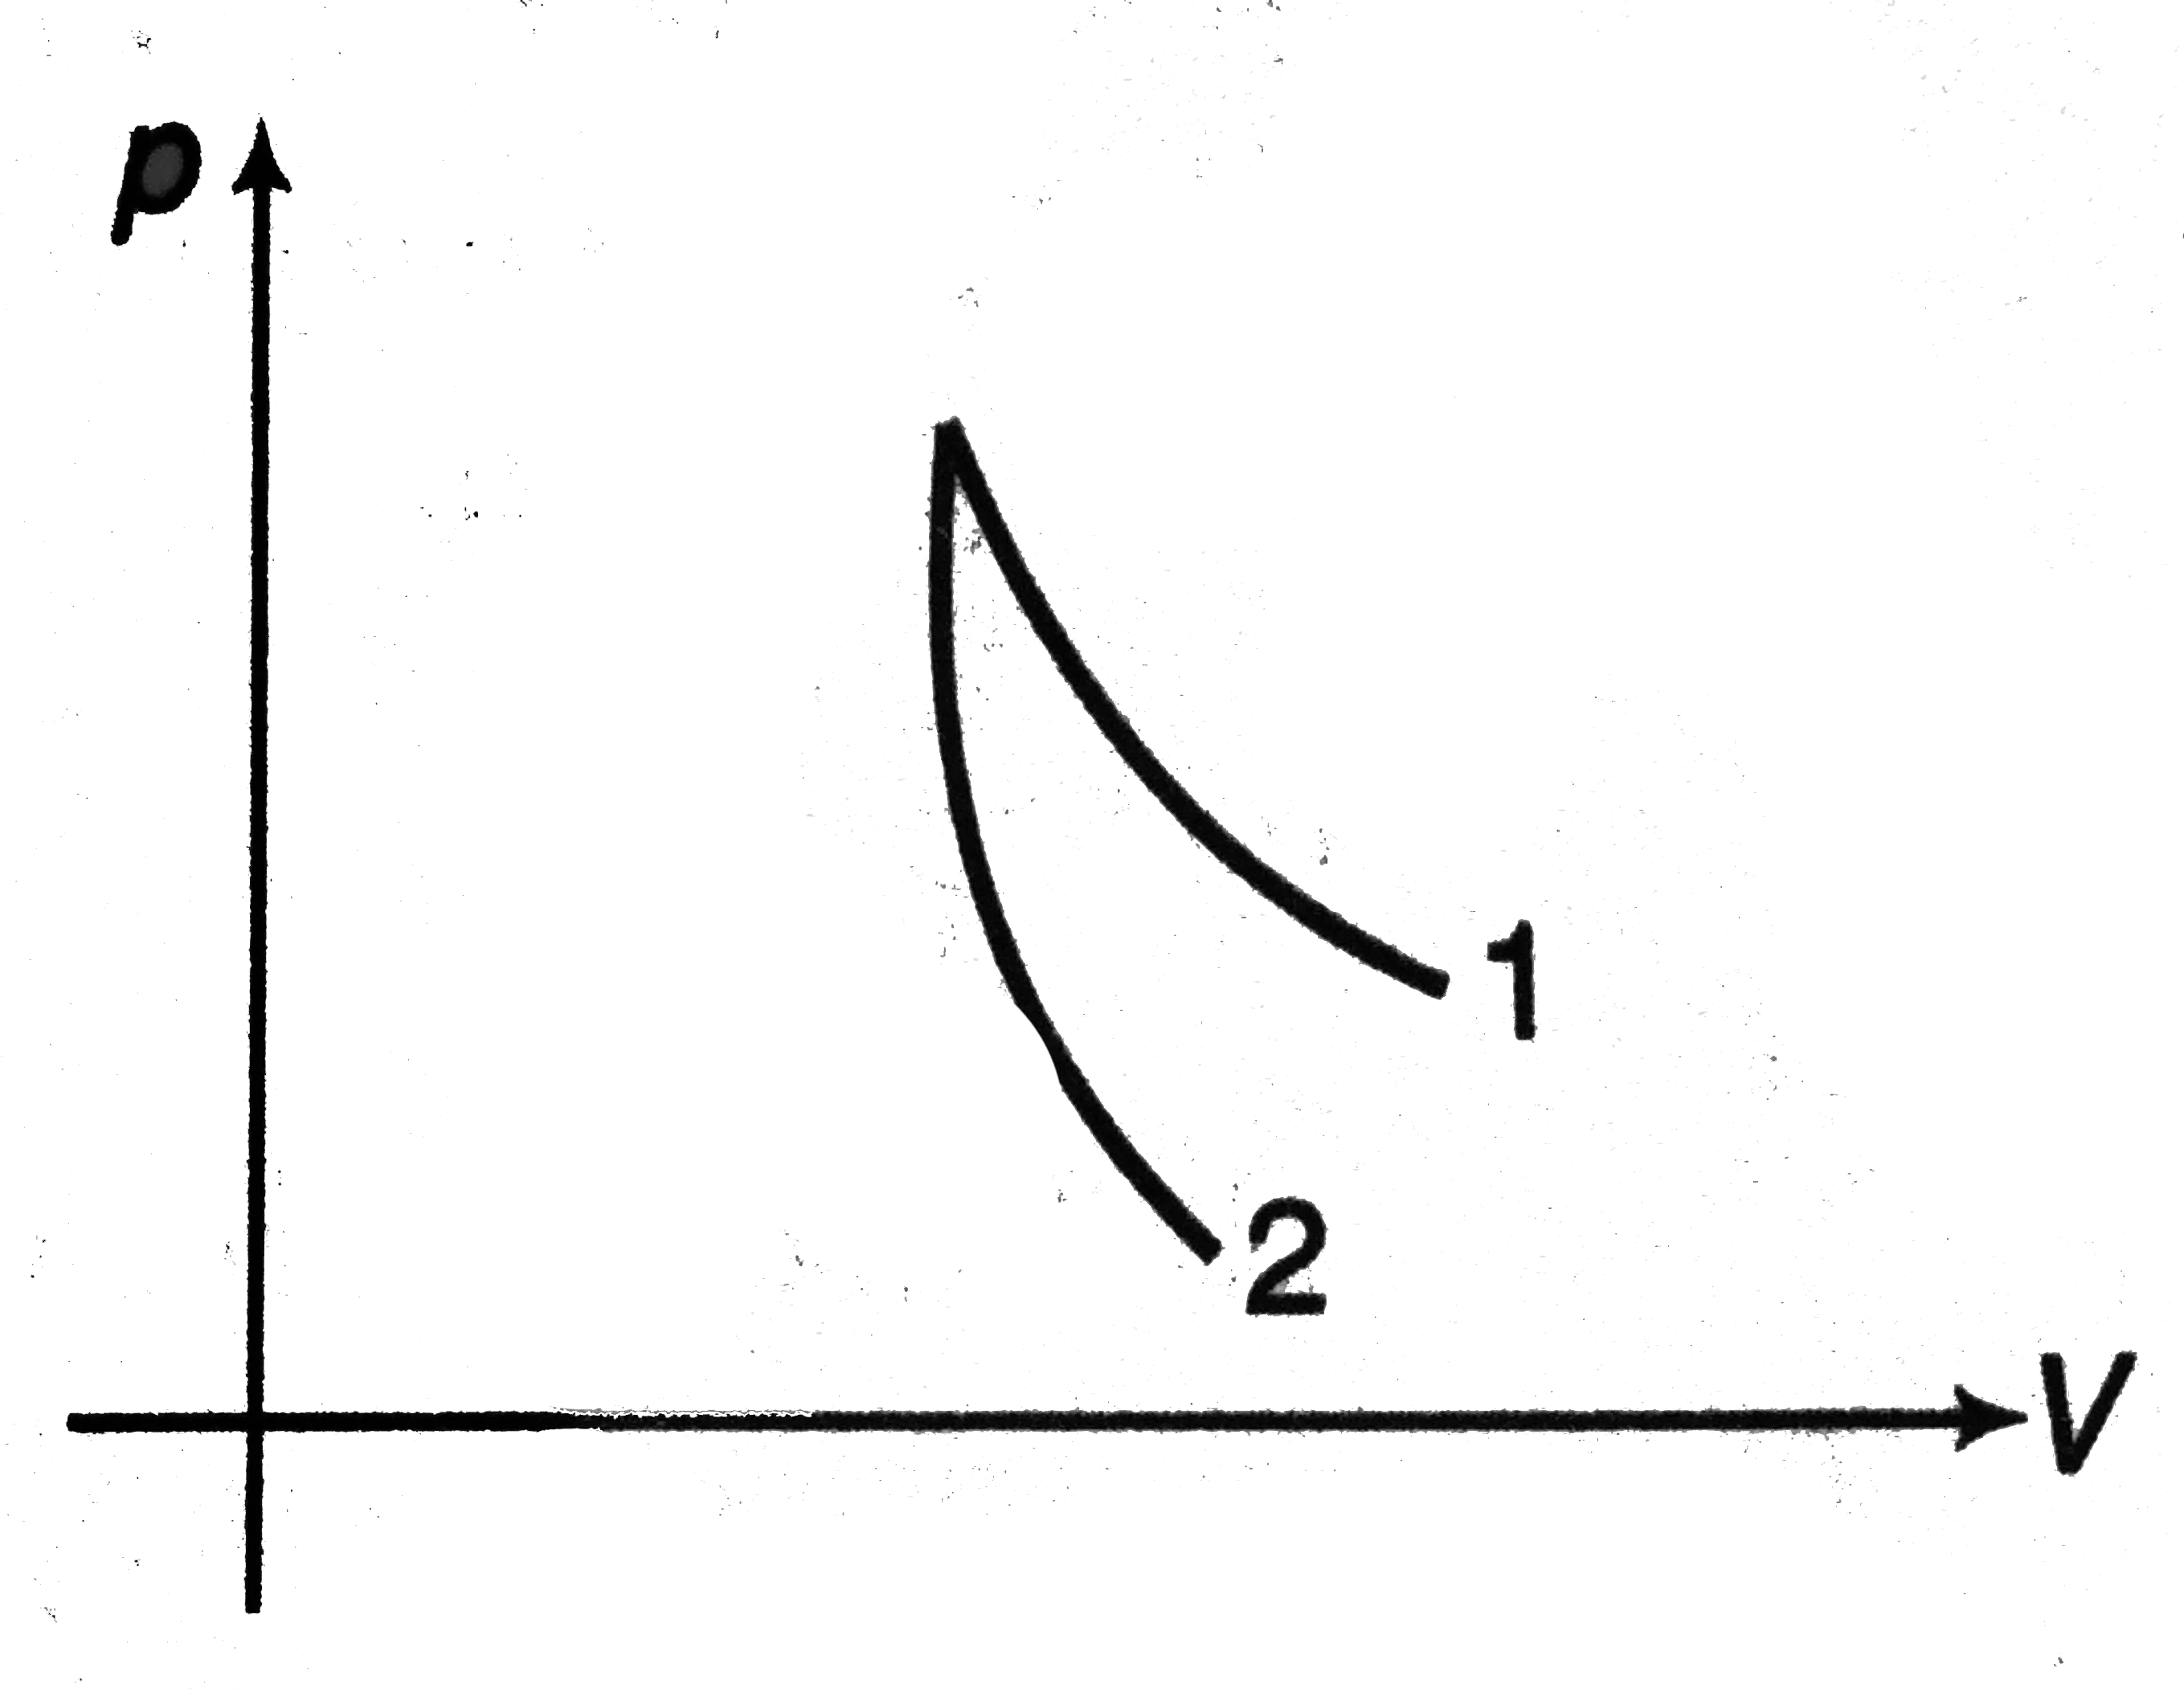
View Solutionp-V plots for two gases during adiabatic processes are shown in the figure. Plots 1 and 2 should correspond respectively to
View Solution