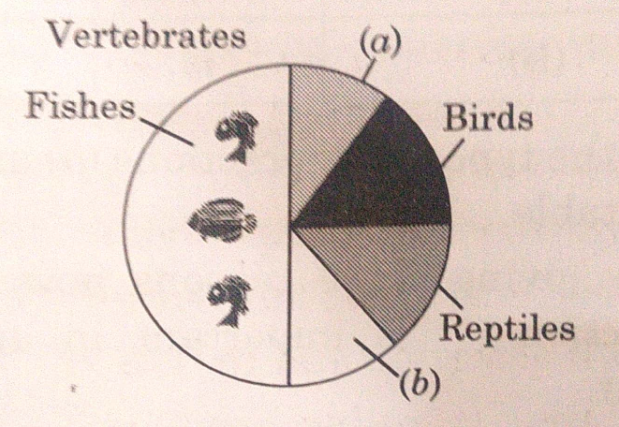
Identify 'a' and 'b' in the figure given below representing proportionate number of major vertebrate taxa.
 Solution in Punjabi
Step by step video & image solution for Identify 'a' and 'b' in the figure given below representing proportionate number of major vertebrate taxa. by Biology experts to help you in doubts & scoring excellent marks in Class 12 exams.
Updated on:21/07/2023Topper's Solved these Questions
Similar Questions
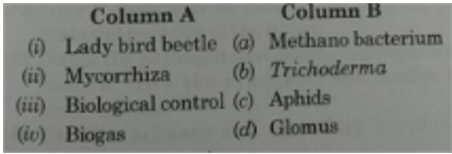
Match the items in column 'A' and 'B' and the choose correct answer

The correct answer is:
View SolutionIf one can induce parthenocarpy through the application of growth substances, which fruits would you select for parthenocarpy and why?
View SolutionGiven pie diagram represents the proportionate number of species of major groups of invertebrates. Identify the groups A and B.

View SolutionThe given pie diagram represents the proportionate number of species of major taxa of vertebrates. Identify the group A and B.

View SolutionIdentify the groups of organism marked A and B in the given pie diagram representing the proportionate number of species of major taxa of plants.
View SolutionThe following are pie diagrams A, B and C related to proportionate number of species of major taxa of invertebrates, vertebrates and plants repectively. Study and select the right option in which all the blanks I, II, III and IV are correctly identified
View SolutionGlobal biodiversity representing proportionate number of species of major taxa of invertebrates, vertbrates and plants are given below , Identify I,II and III by selecting the correct option :

View SolutionIdentify 'a' and'b' in the figure given below representing proportionate number of major vertebrate taxa.
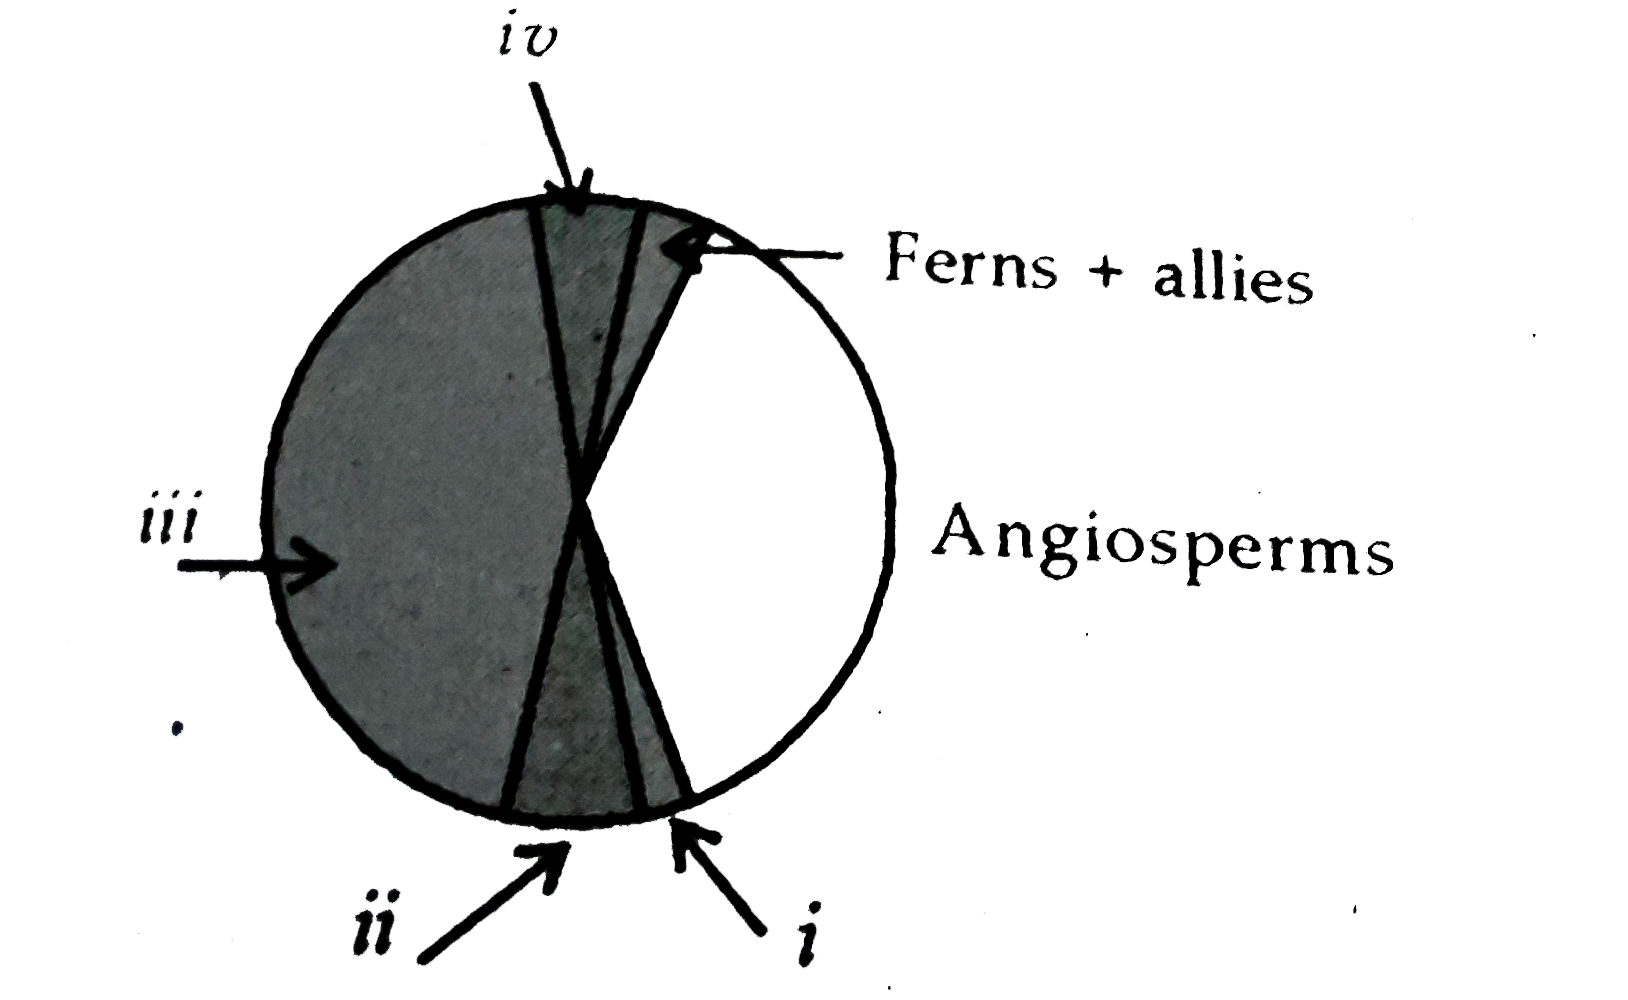
View SolutionIndentify the areas labelled (i), (ii), (iii) and (iv) in the pie chart given below representing the biodiversity of plants showing their proportionate number of species of major taxa.

View SolutionName the unlabelled areas 'a' and 'b' of the pie chart representing the biodiversity of plants showing their proportionate number of species of major taxa.
View SolutionGiven below are pie diagrams A, B and C related to proportionate number of species of major taxa of invertebrates, vartebrates and plants respectively. Critically study and fill in the blanks (a), (b), (c ) and (d).
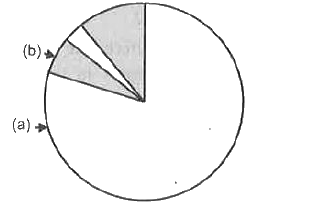
View SolutionName the unlabeled areas 'a' and 'b' of the pie chart (given above) representing the global biodiversity of invertebrates showing their proportionate number of species of major taxa.

View SolutionIdentify 'a' and'b' in the figure given below representing proportionate number of major vertebrate taxa.
View SolutionIdentify the areas labelled (i), (ii), (iii) and (iv) in the pie chart given below representing the biodiversity of plants showing their proportionate number of species of major taxa.

View SolutionThe given pie diagram represents the proportionate number of species of major taxa of vertebrates. Identify the group A and B.

View SolutionIdentify the groups of organism marked A and B in the given pie diagram representing the proportionate number of species of major taxa of plants.
View Solution
