Construct a frequency distribution table for the data on weights ( in kg.) of 20 students of a class using intervals 30-35,35-40 and so on.
40,38,33,48,60,53,31,46,34,36,49,41,55,49,65,42,44,47,38,39.Solution in Punjabi
Step by step video & image solution for Construct a frequency distribution table for the data on weights ( in kg.) of 20 students of a class using intervals 30-35,35-40 and so on.40,38,33,48,60,53,31,46,34,36,49,41,55,49,65,42,44,47,38,39. by Maths experts to help you in doubts & scoring excellent marks in Class 8 exams.
Topper's Solved these Questions
Similar Questions
Draw an appropriate graph to represent the given information.
 02:33View Solution
Which of the following numbers are not perfect cubes?
392.02:38View SolutionThe cost of 5 metres of a particular quality of cloth is Rs 210. Tabulate the cost of 2, 4, 10 and 13 metres of cloth of the same type.
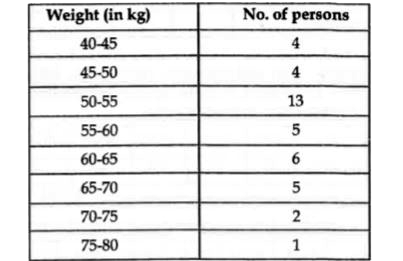
02:11View SolutionThe following is the distribution of weights (in kg) of 40 persons.

Construct a cumulative frequency distribution (of the less than type) table for the data above.07:47View SolutionGiven below are the marks obtained by 30 students of a class, Using the class intervals of equal class size in which one class interval is 30-40 (excluding 40), construct a frequency table.
42743948428035385281317265587782796547306456394860637250463505:20View SolutionFollowing are the marks obtained by 30 students in a examination

Taking class intervals 0−10,10−20,…..40−50 construct a frequency table.06:03View Solutionअंतरालों 30−35,30−40 इत्यादि का प्रयोग करते हए, एक कक्षा के 20 विद्यार्थिओं के भारों (kg में) के निम्नलिखित आंकड़ों के लिए एक बारंबारता बंटन सारणी बनाइए :
40,38,33,48,60,53,31,46,34,36,49,41,55,49,65,42,44,47,38,3903:15View Solution30 छात्रों के एक परीक्षा के प्राप्तांक निम्नलिखित हैं :

वर्ग अन्तराल 0-10, 10-20,……,40-50 लेकर बारम्बारता सारणी बनाइए |03:17View SolutionThe weights (in kg) of 30 students of a class are
39,43,32,37,29,26,31,45, 46,31,37,38,30,39,36,41,35,34,41,46,39,38,36,38,40,42,33,43,44,33.
Prepare a frequency distribution table using one class interval as 30-35 in which 30 is included and 35 excluded. using the above data, draw a histogram.03:18View SolutionThe following is the distribution of weight (in kg) of 40 persons. Construct a cumulative frequency distribution (of less-than type). Table for the data:
 06:31View Solution
The following is the distribution of weights (in kg) of 40 persons.

Construct a cumulative frequency distribution (of the less than type) table for the data above.04:12View Solution40 व्यक्तियों के भारों में (kg में) का बंटन निम्नलिखित है:

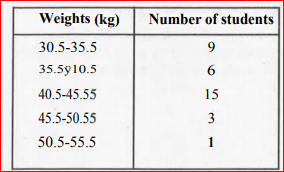
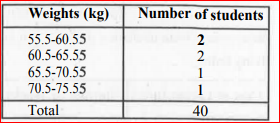
उपरोक्त आंकड़ों के लिए से कम प्रकार की एक संचयी बारंबारता बंटन सारणी की रचना कीजिए।05:04View SolutionConsider the following frequency distribution table representing the weights of 40 students of a class .

 Draw a histogram to represent the above data.05:19View Solution
Construct a frequency distribution table for the data on weights (in kg) of 20 studetns of a class using intervals 30-35, 35-40 and so on.
40,38, 33, 48, 53, 46, 34, 36, 49, 41, 55, 49, 65, 42, 44, 47, 38, 39.02:18View Solutionकिसी कक्षा के 25 छात्रों द्वारा भूगोल में प्राप्तांक निम्नांकित हैं : 56415364315333706174325356645688387056647453536131
वर्ग-अन्तराल 30−40 (40 सम्मिलित नहीं) आदि, आदि लेकर एक बारम्बारता बंटन सारणी बनायें।06:20View Solution

