Draw a histogram for the frequency table made for the data in figure ,and answer the following questions.
Which group has the maximum number of workers ?Solution in Punjabi
Step by step video & image solution for Draw a histogram for the frequency table made for the data in figure ,and answer the following questions.Which group has the maximum number of workers ? by Maths experts to help you in doubts & scoring excellent marks in Class 8 exams.
Topper's Solved these Questions
Similar Questions
Draw an appropriate graph to represent the given information.
 06:28View Solution
Which of the following numbers are not perfect cubes?
392.04:02View SolutionThe cost of 5 metres of a particular quality of cloth is Rs 210. Tabulate the cost of 2, 4, 10 and 13 metres of cloth of the same type.
02:56View SolutionDraw a histogram for the frequency table made for the data in Question 3, and answer the following questions.(i) Which group has the maximum number of workers?(ii) How many workers earn Rs 850 and more?(iii) How many workers earn less than Rs 850?
02:51View SolutionDraw a histogram and frequency polygon of the following data.
 07:03View Solution
Draw a histogram for the frequency distribution of the following data:
 07:18View Solution
Draw a histogram for the frequency distribution of the following data:
 01:30View Solution
Draw a histogram for the frequency table made for the data in Question 3, and answer the following questions.(i) Which group has the maximum number of workers?(ii) How many workers earn Rs 850 and more?(iii) How many workers earn less than Rs 850?
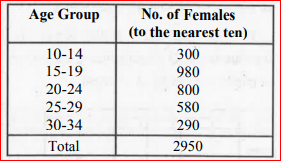
View SolutionThe following table presents the number of literate females in the age group (10-34) in town.
 Draw a histogram to represent the above data03:47View Solution
ਪ੍ਰਸ਼ਨ 3 ਵਿੱਚ ਦਿੱਤੇ ਅੰਕੜਿਆਂ ਤੋਂ ਪ੍ਰਾਪਤ ਸਾਰਣੀ ਦੇ ਲਈ ਇੱਕ ਆਇਤ ਚਿੱਤਰ ਬਣਾਉ ਅਤੇ ਹੇਠਾਂ ਲਿਖੇ ਪ੍ਰਸ਼ਨਾਂ ਦੇ ਉੱਤਰ ਦਿਓ : ਕਿਸ ਗੁੱਟ ਵਿੱਟ ਮਜ਼ਦੂਰਾਂ ਦੀ ਗਿਣਤੀ ਸਭ ਤੋਂ ਜ਼ਿਆਦਾ ਹੈ?
05:56View Solutionप्रश्न 26 में दिए आँकड़ों से प्राप्त सारणी के लिए एक आयत चित्र बनाइए और निम्नलिखित प्रश्नों के उत्तर दीजिए :
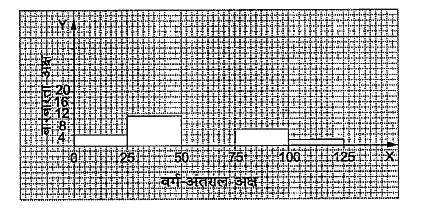
(i) किस समूह में श्रमिकों की संख्या सबसे अधिक है ?02:35View Solutionनिम्नांकित आयतचित्र देखिए और इसके आधार पर बारंबारता सारणी बनाइए।
 02:24View Solution
Draw a histogram and frequency polygon from the following data:
 03:50View Solution
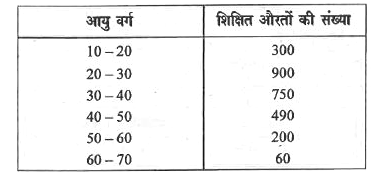
निम्न दी गई सारणी किसी नगर में विभिन्न आयु वर्गों में शिक्षित औरतों की संख्या दर्शाती है।

उपरोक्त आंकड़ों को दर्शाने के लिए एक आयतचित्र बनाएं।04:51View SolutionThe maximum movements of thirty different land animals are organized in the form of a frequency table. Draw a histogram for these data.
03:09View Solution

