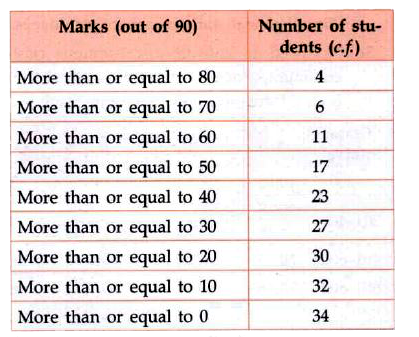
Draw a histogram for the frequency distribution of the following data:

Step by step video & image solution for Draw a histogram for the frequency distribution of the following data: by Maths experts to help you in doubts & scoring excellent marks in Class 8 exams.
Updated on:21/07/2023Topper's Solved these Questions
- DATA HANDLING BOOK - RS AGGARWALCHAPTER - DATA HANDLING EXERCISE - Exercise 21B
6 Videos
- CUBES AND CUBE ROOTSBOOK - RS AGGARWALCHAPTER - CUBES AND CUBE ROOTSEXERCISE - Test Paper-4 (Fill in the blanks)
4 Videos
- DIRECT AND INVERSE PROPORTIONSBOOK - RS AGGARWALCHAPTER - DIRECT AND INVERSE PROPORTIONSEXERCISE - TEST PAPER -12 (Fill in the blanks )
5 Videos
Similar Questions
From the frequency distribution table from the following data
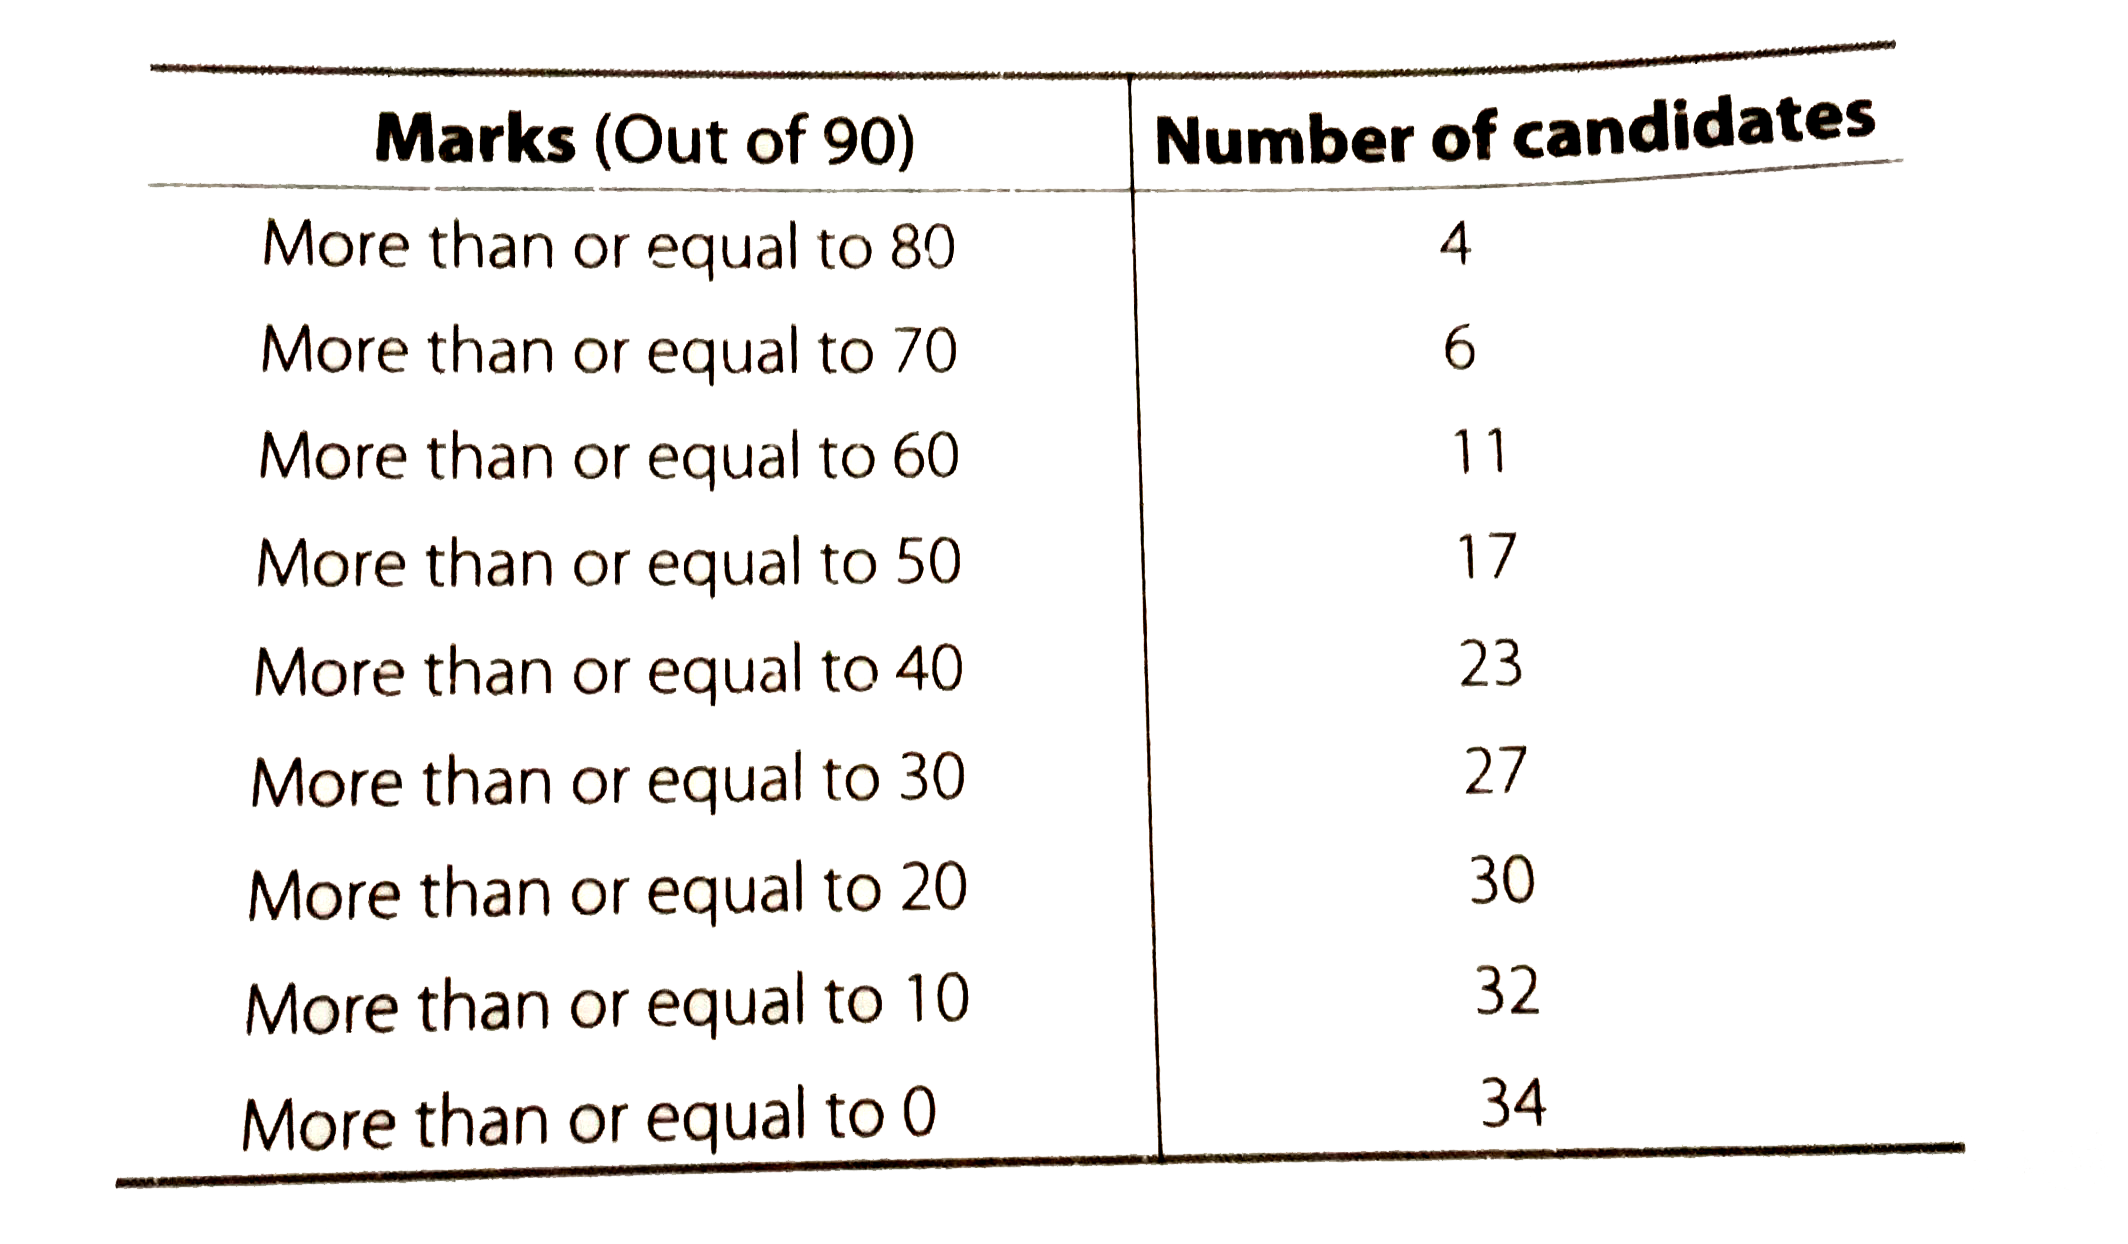
View SolutionDraw a histogram for the following frequency distribution.
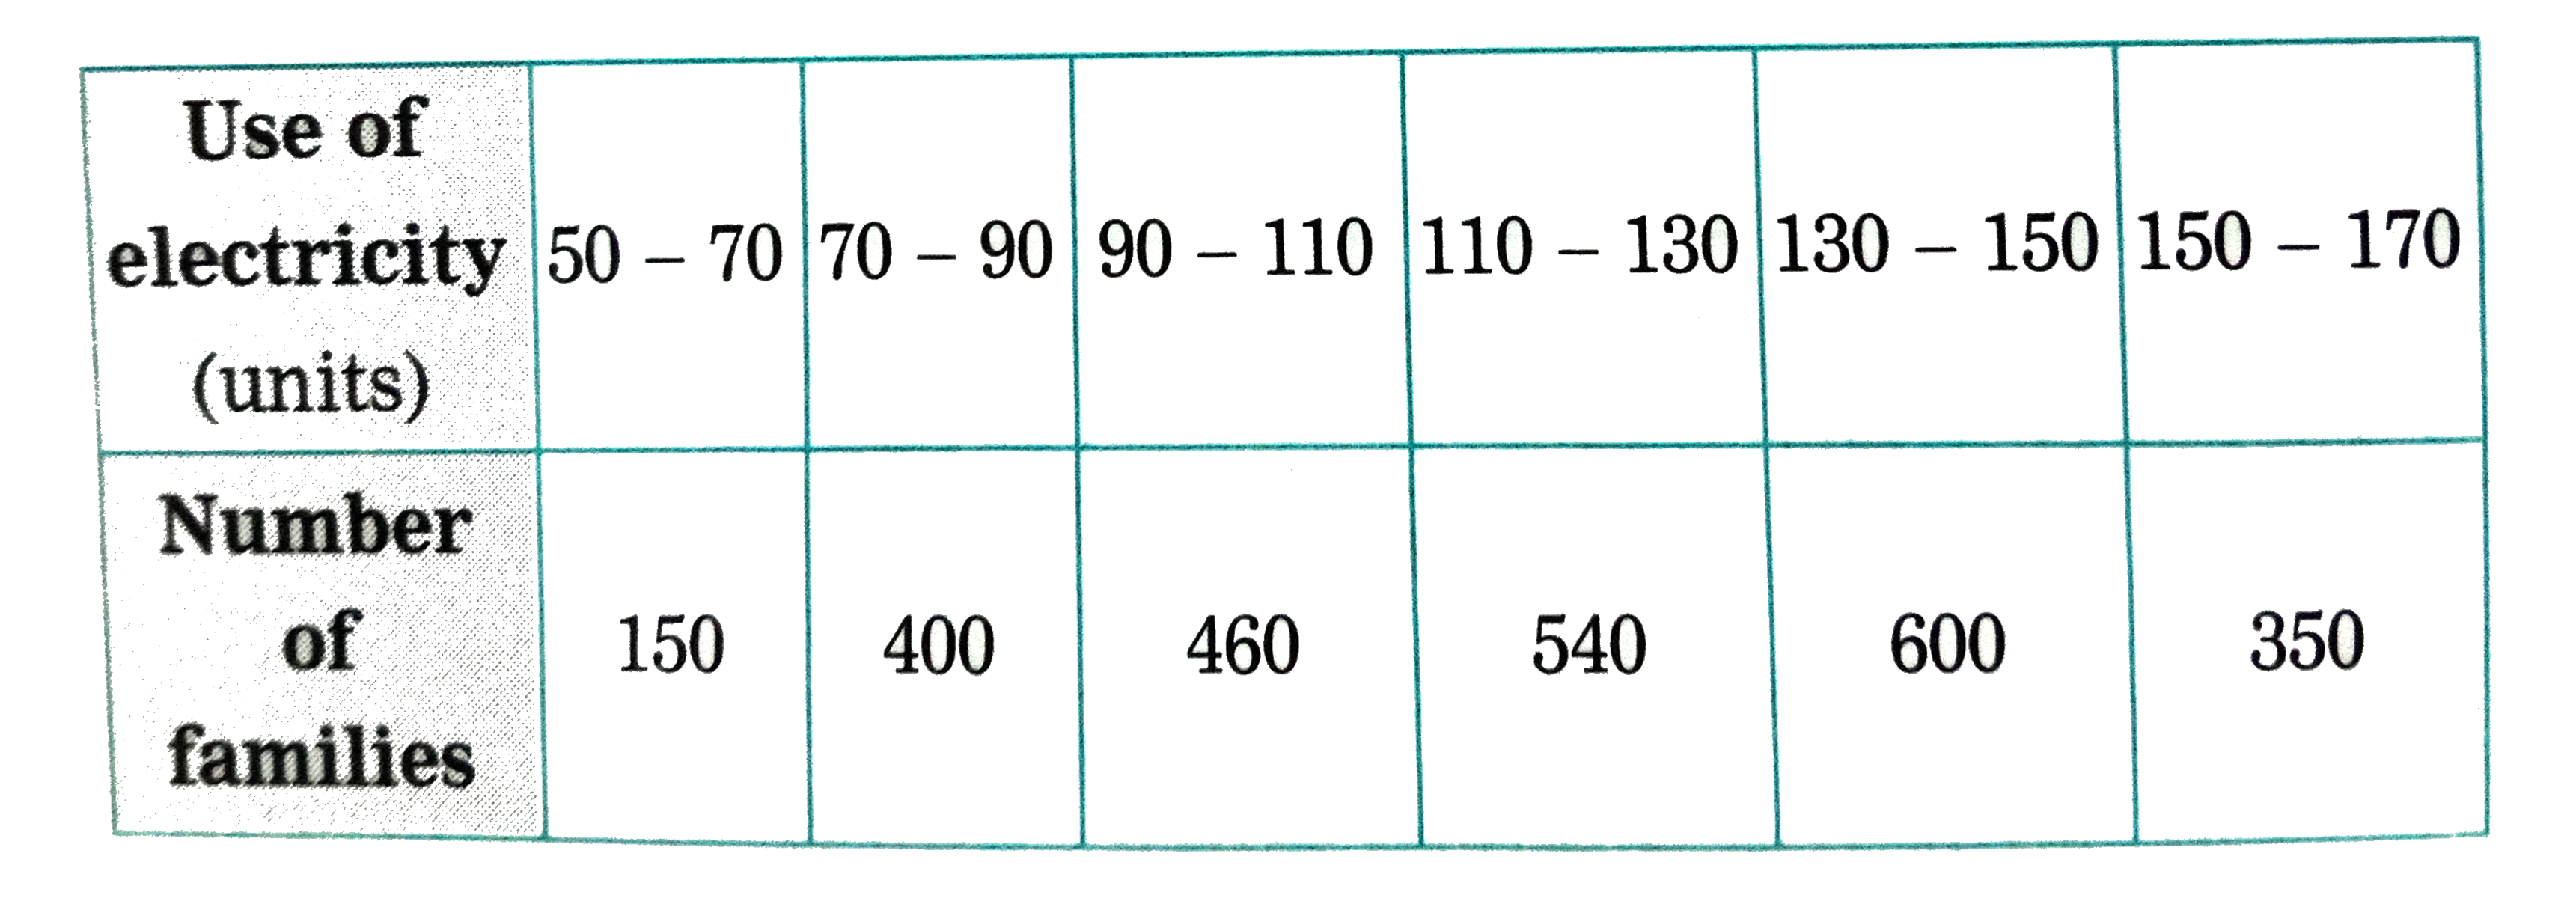
View SolutionDraw a histogram of the following distribution.
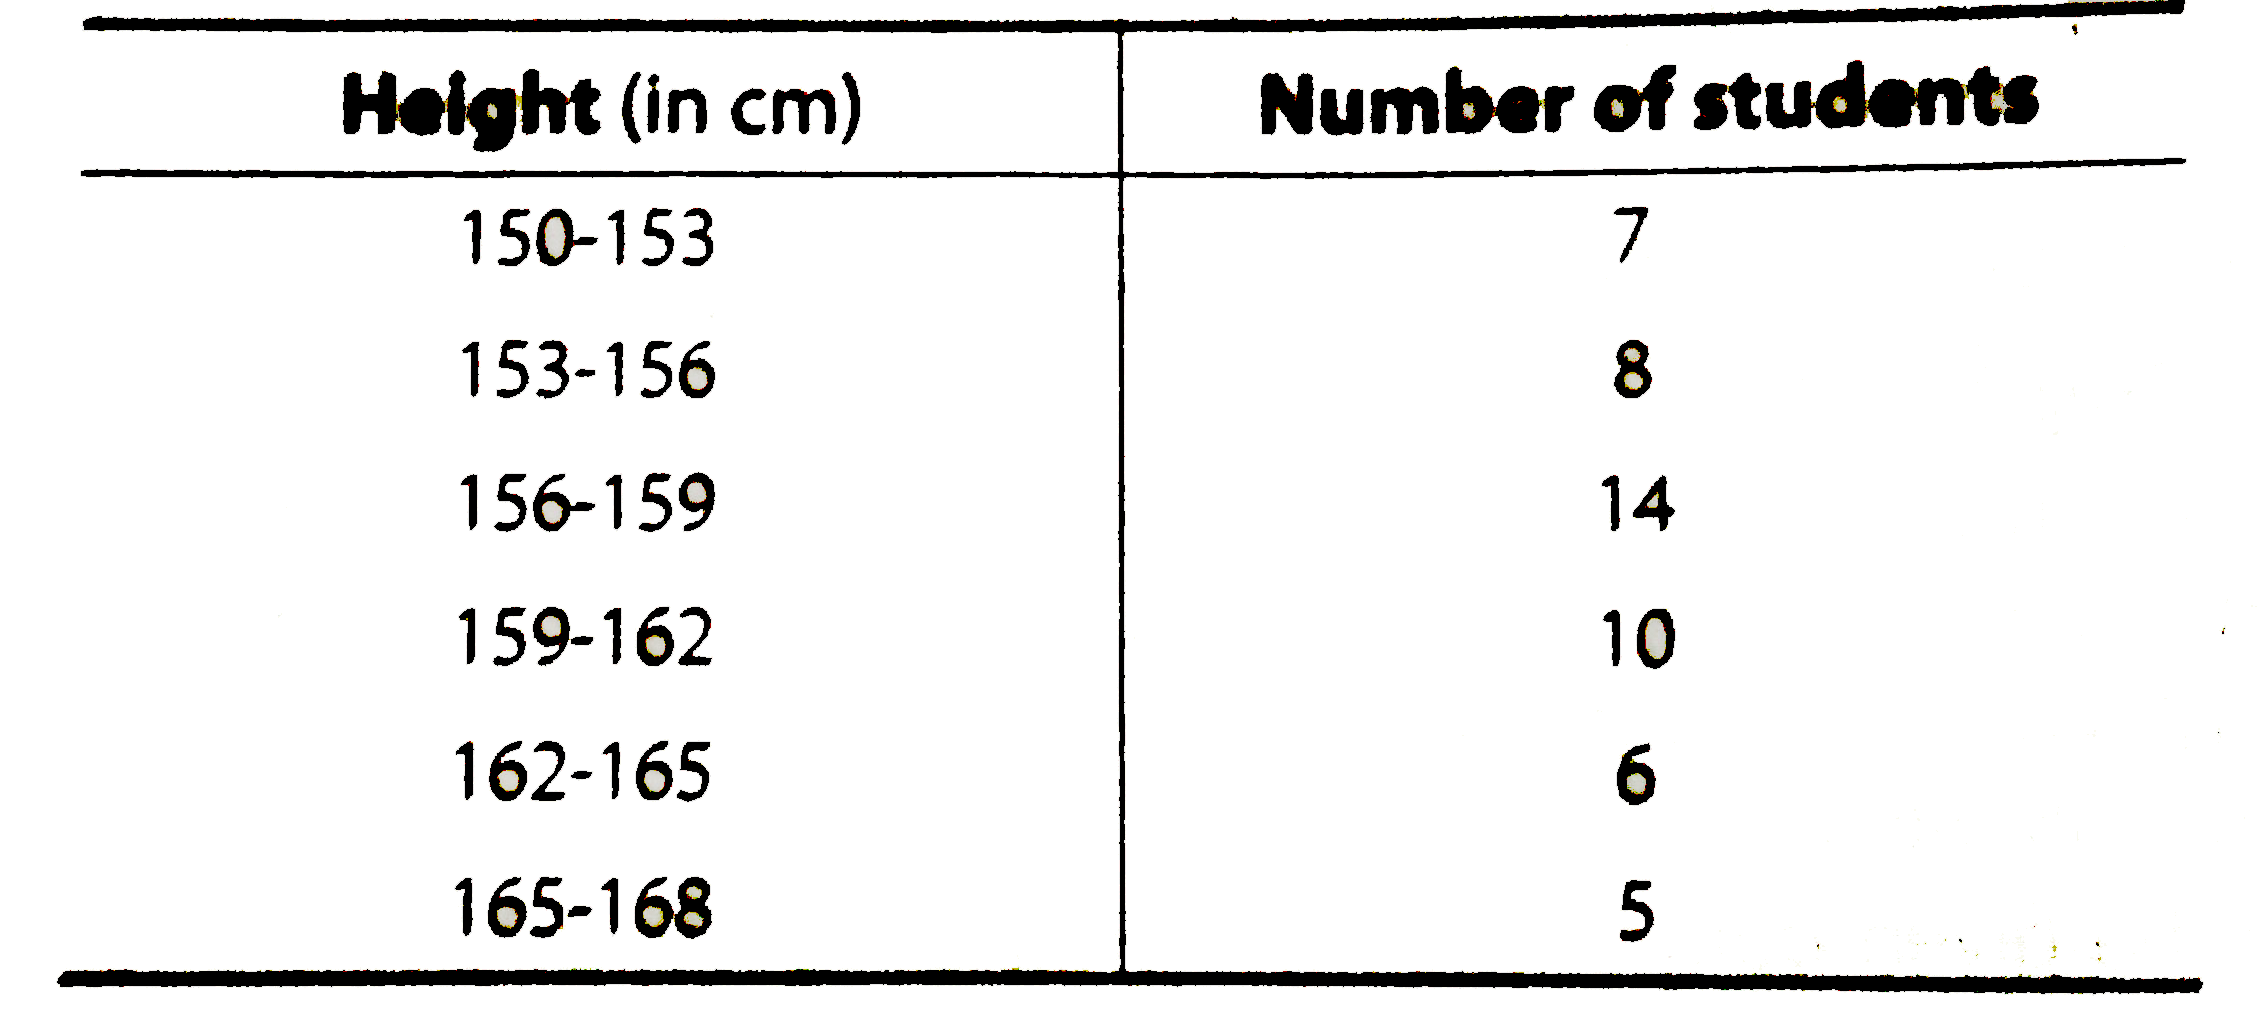
View SolutionDraw a historgram for the following frequency distribution

View SolutionDraw the histogram for the following distribution :
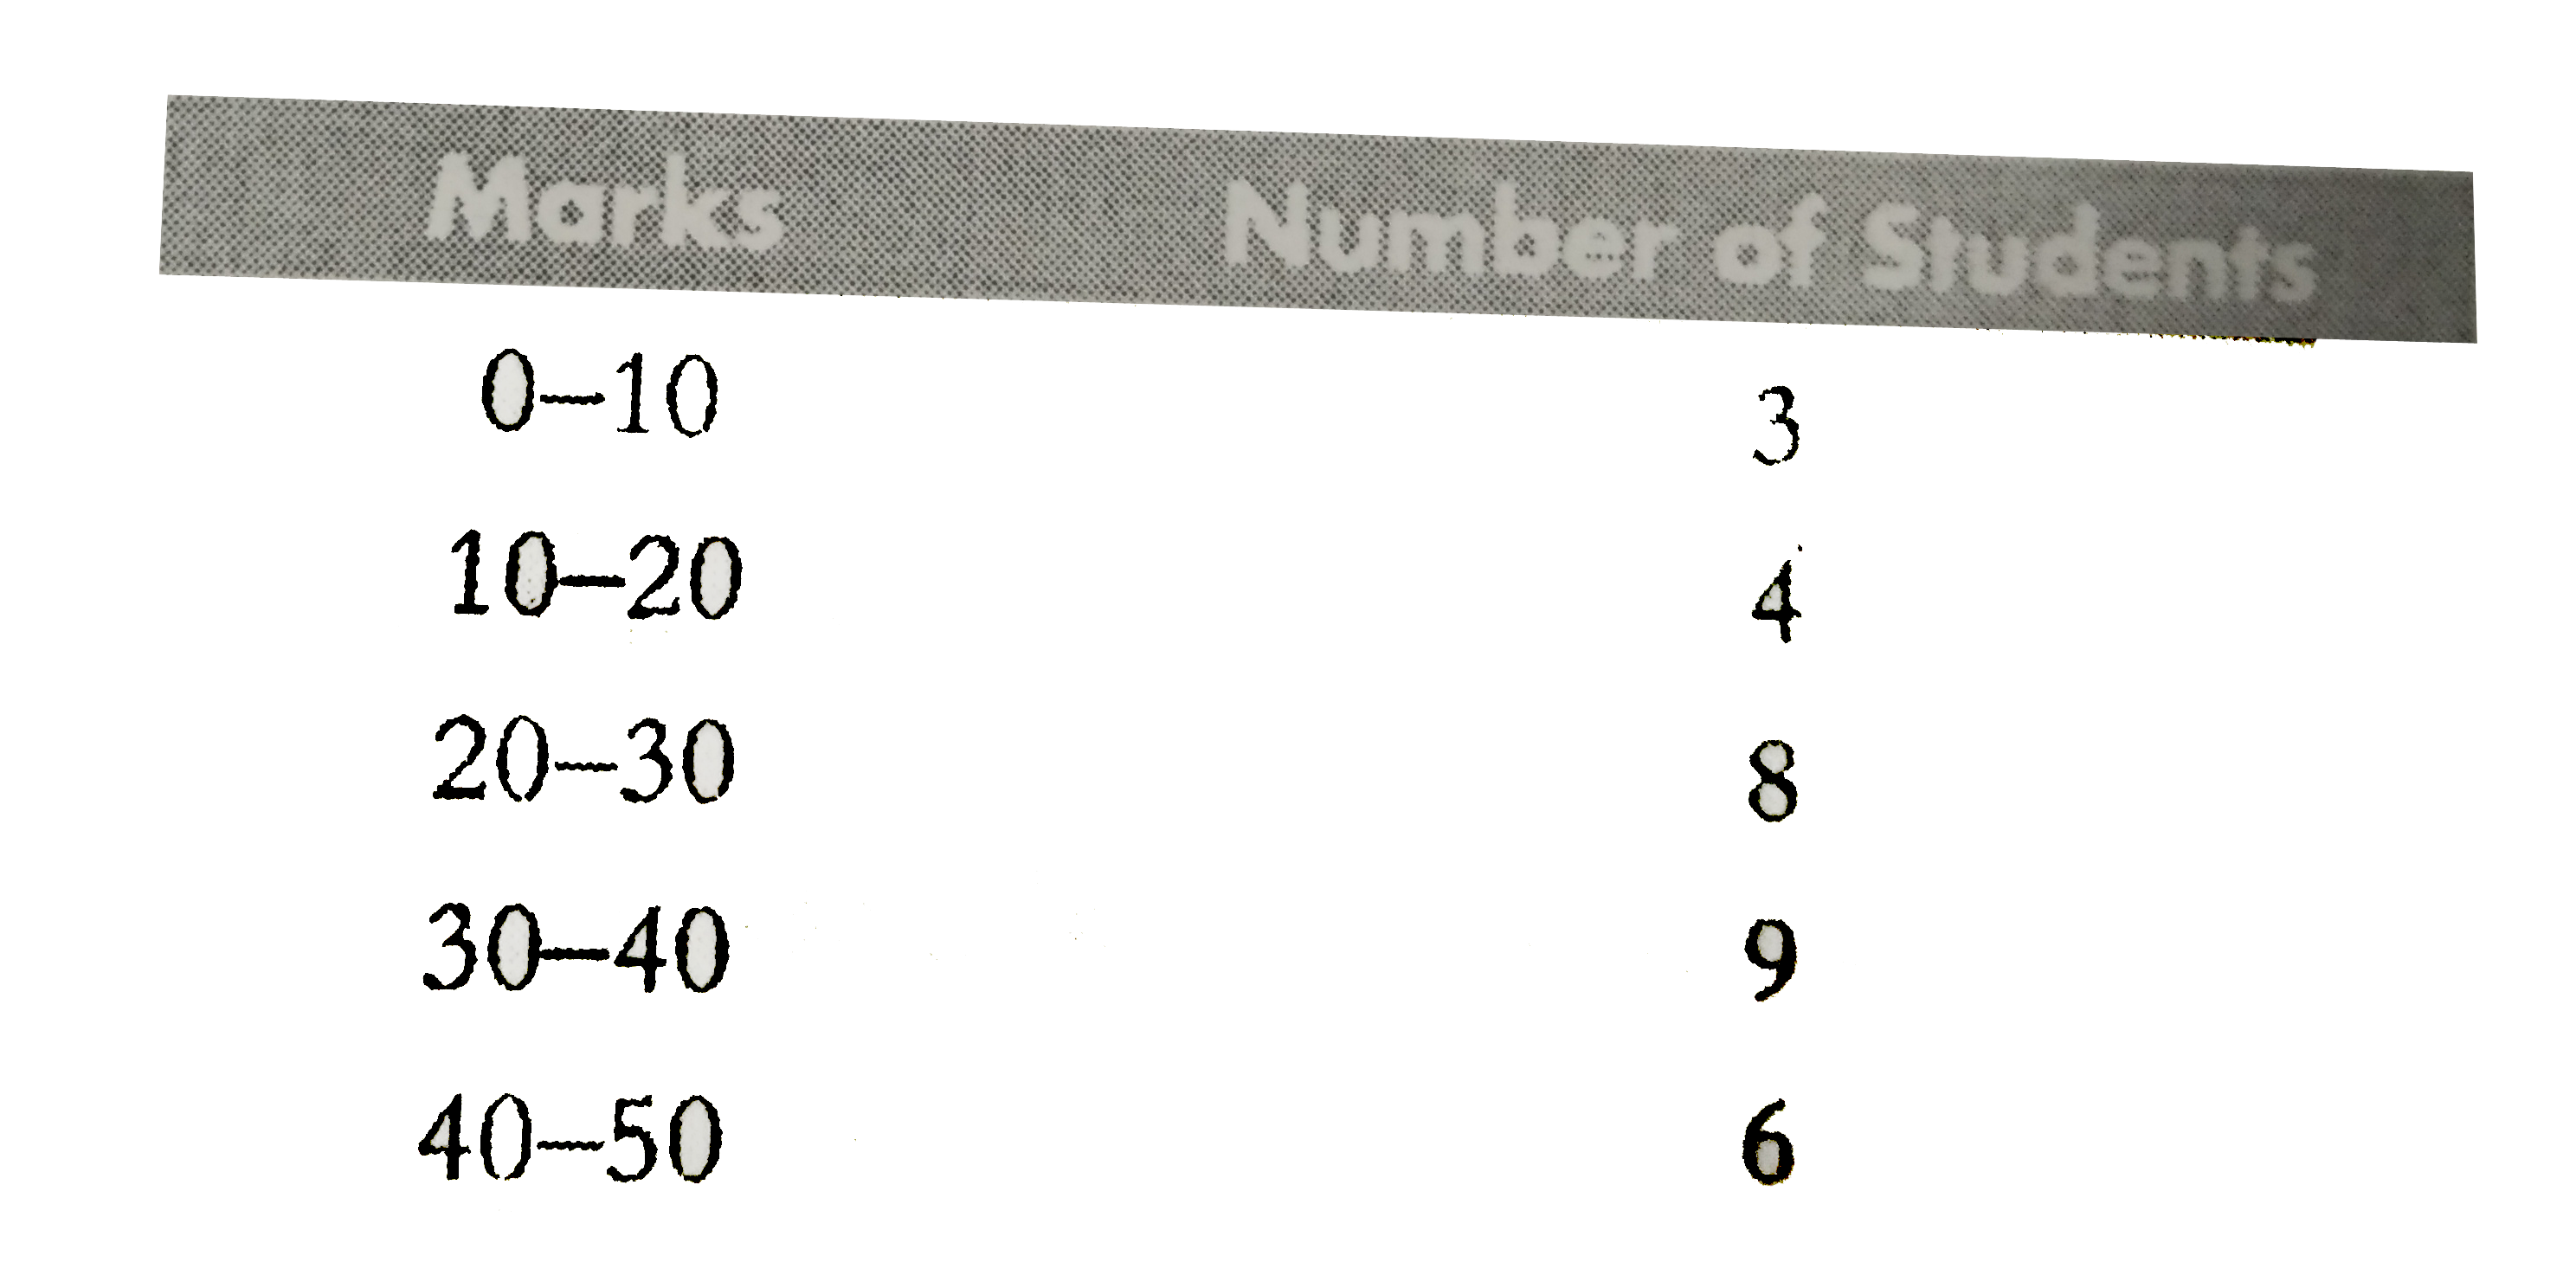
View SolutionDraw the histogram for the following frequency distribution :

View SolutionDraw the Histogram for the following frequency distribution.

View SolutionDraw a histogram for the following data:

View SolutionDraw a histogram for the following data.

View SolutionForm the frequency distribution table from the following data:
Construct the frequency distribution table for the above data.
View Solution
