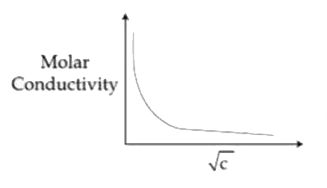
The variation of molar conductivity wih concentration of an electrolyte (X) in aqueous solution is shown in the given figure .

The electrolyte X is :
A
B
C
D
Video Solution
Text Solution
The correct Answer is:A
This graph is for because on dilution, more molecules dissociate which will increase the number of ions and also the mobility.
|
Updated on:21/07/2023
Similar Questions
Knowledge Check
- Question 1 - Select One
The variation of molar conductivity wih concentration of an electrolyte (X) in aqueous solution is shown in the given figure .

The electrolyte X is :ACH3COOHBHClCNaClDKNO3 - Question 2 - Select One or More
A strong electrolyte in aqueous solution exhibits:
Aalmost completely dissociatedBhydrationCpartial dissociationDNone of these - Question 3 - Select One
An aqueous solution of an electrolyte
Aconducts electricity without any chemical changeBconducts electricity with chemical decompositionCis an insulatorDall are correct
Explain with a graph the variation of molar conductivity of a strong electrolyte with dilution.
View SolutionHow is molar conductivity related to concentration of the electrolyte ? How will you account for this variation for weak and strong electrolytes ?
View SolutionThe variation of equivalent conductance versus concentration of a strong electrolyte is correctly given in the plot
View SolutionConductivity of aqueous solution of an electrolyte depends on
View SolutionThe variation of equivalent conductance of weak electrolyte with √C is correctly shown in which of the following figures?
View Solution

