The variation of equivalent conductance of weak electrolyte with is correctly shown in which of the following figures?
A

B

C

D

Text Solution
The correct Answer is:D
|
Topper's Solved these Questions
- ELECTROCHEMISTRYBOOK - MTG GUIDECHAPTER - ELECTROCHEMISTRYEXERCISE - AIPMT/NEET(MCQs)
5 Videos
- ELECTROCHEMISTRYBOOK - MTG GUIDECHAPTER - ELECTROCHEMISTRYEXERCISE - NEET Café (Topicwise Practice Questions) (BATTERIES, FUEL CELLS AND CORROSION)
6 Videos
- COORDINATION COMPOUNDSBOOK - MTG GUIDECHAPTER - COORDINATION COMPOUNDSEXERCISE - CHECK YOUR NEET VITALS
30 Videos
- GENERAL PRINCIPALS AND PROCESSES OF ISOLATION OF ELEMENTSBOOK - MTG GUIDECHAPTER - GENERAL PRINCIPALS AND PROCESSES OF ISOLATION OF ELEMENTSEXERCISE - AIPMT/NEET (MCQs)
10 Videos
Similar Questions
Knowledge Check
The variation equivalent conductance of stronge electrolyte with √Concentration is correctly shown in the figure.
A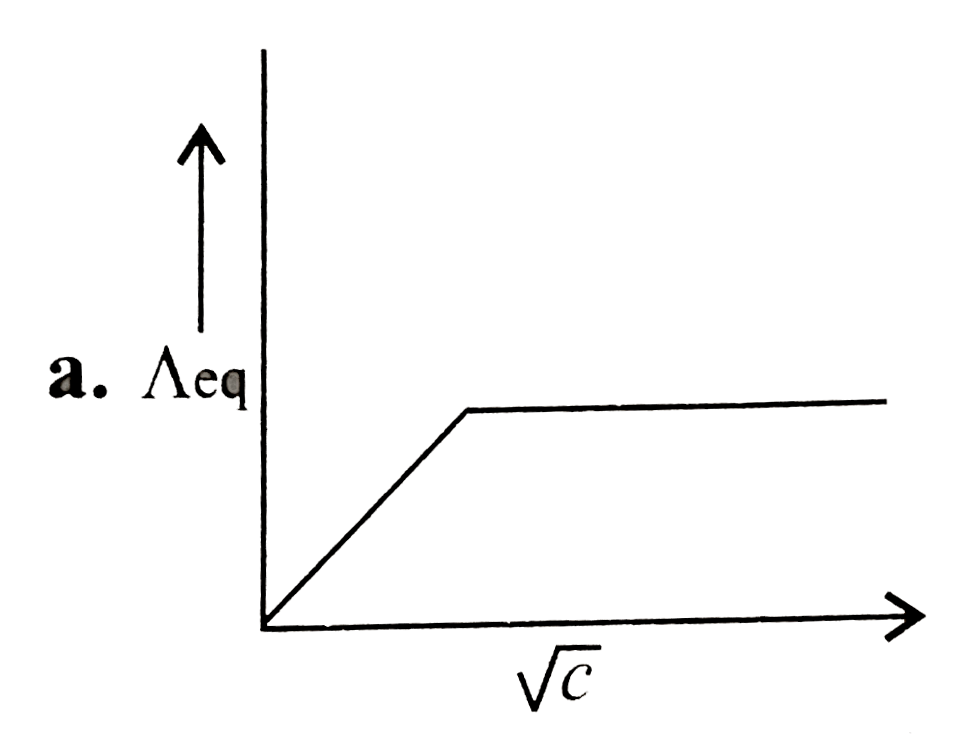 B
B C
C D
D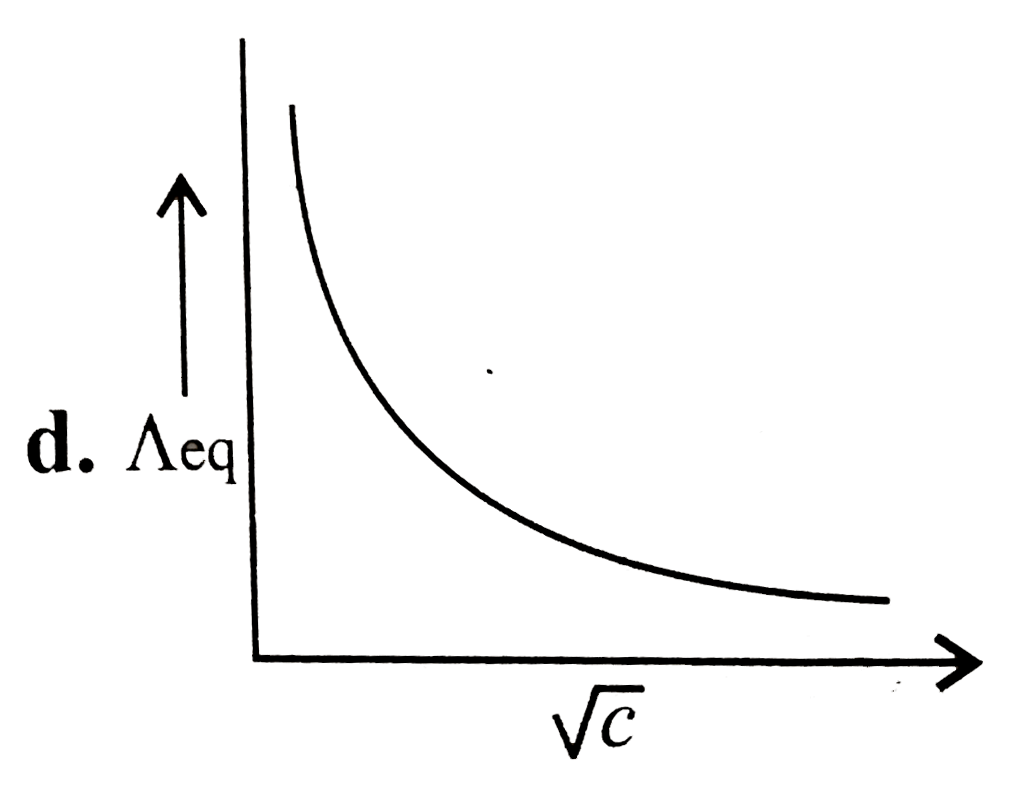
The equivalent conductance of strong electrolyte:
AIncreases on dilution slightlyBDecreases on dilutionCDoes not change with dilutionDDepends upon density of electrolytes itselfThe variation of equivalent conductance of a weak electrolyte with (concentration)1/2 is represented as
A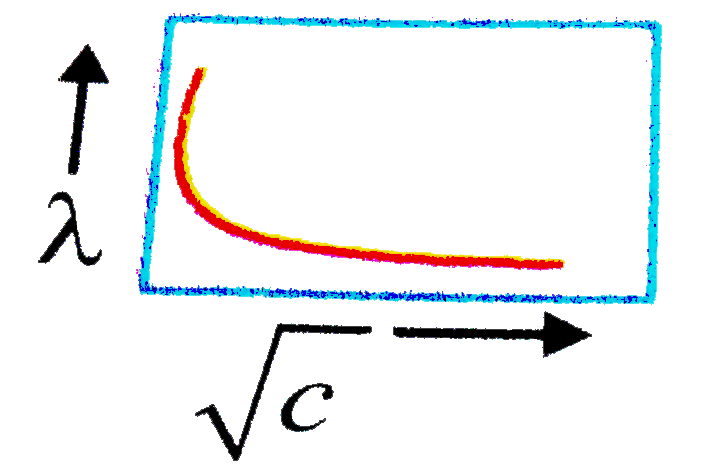 B
B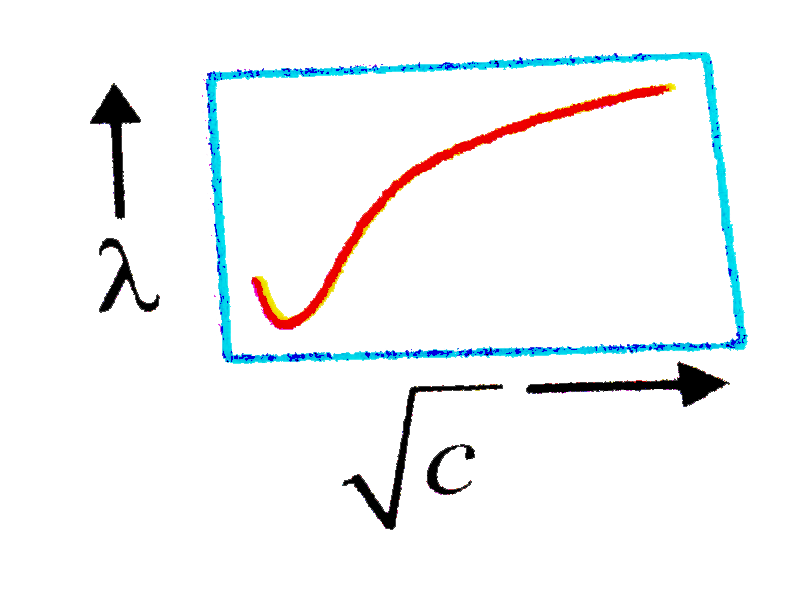 C
C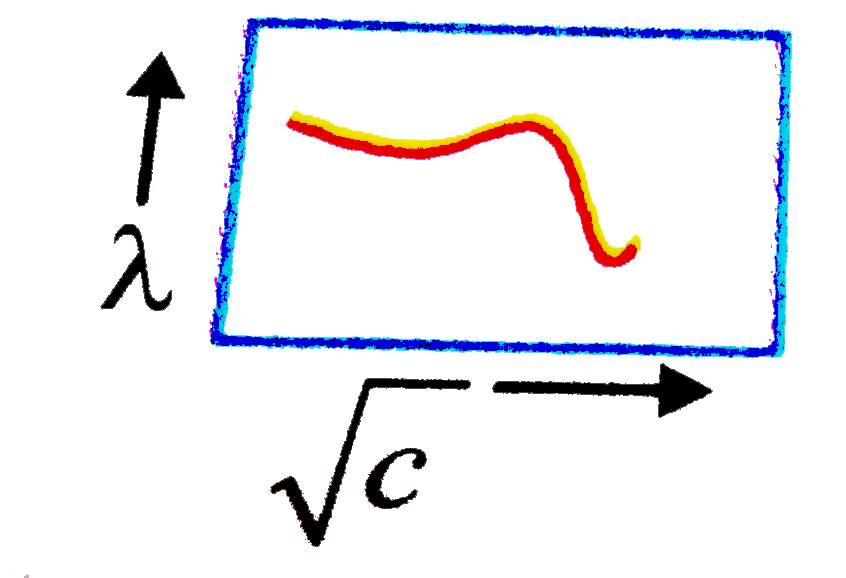 D
D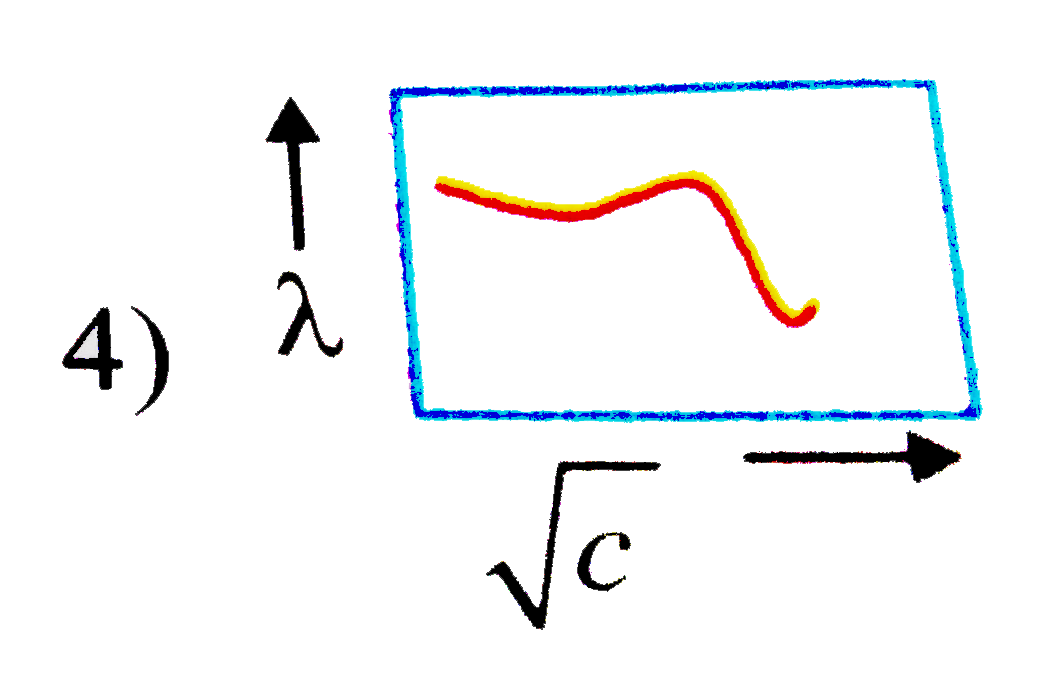
The equivalent conductance of strong electrolyte:
View SolutionThe increase in equivalent conductivity of a weak electrolyte with dilution is due to :
View SolutionThe increases in equivalent conductivity of a weak electrolyte with dilution is due to :
View SolutionThe variation of equivalent conductance versus concentration of a strong electrolyte is correctly given in the plot
View SolutionThe increases in equivalent conductivity of a weak electrolyte with dilution is due to :
View Solution
