In 2005, for each of the 14 million people present in a country, 0.028 were born and 0.008 died during the year. Using exponential equation, the number of people present in 2015 is predicted as
25 millions
17 millions
20 millions
18 millions
The correct Answer is:B
dNdt=rN
r:a.:0.028−0.008=0.02
dt-= 2015 - 2005 = 10 years
N = N2005 = 14 million
dN = change in population in 10 years
dNdt=0.02×14
dN=0.02×14×10
dN = 2.8 million
dN=N2015−N2005
N2015=dN+N2005
=2.8+14
= 16.8= 17 million
Similar Questions
The population of a certain is known to increase at a rate proportional to the number of people presently living in the country. If after two years the population has doubled, and after three years the population is 20,000 estimates the number of people initially living in the country.
View SolutionThe population of a certain is known to increase at a rate proportional to the number of people presently living in the country. If after two years the population has doubled, and after three years the population is 20,000 estimates the number of people initially living in the country.
View Solution
Knowledge Check
A marketing team conducted a study on the use of smartphones. In a certain metropolitan area, there were 1.6 million smartphone users at the end of 2018. The marketing team predicted that the number of smartphone users would increase by 35 percent each year beginning in 2019. If y represents the number of smartphone users in this metropolitan area after x years, then which of the following equations best models the number of smartphone users in this area over time ?
Ay=1,600,000(1.35)xBy=1,600,000(35)xCy=35+1,600,000Dy=1.35x+1,600,000
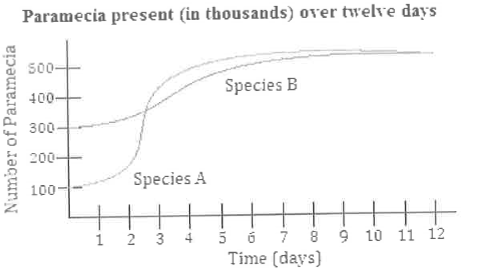
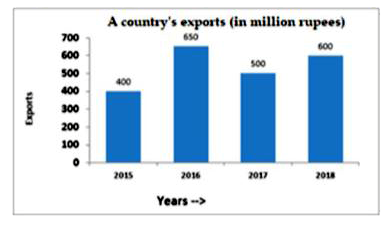
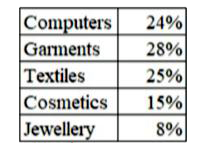
A small puddle is monitored by scientists for the number of paramecia present. The scientists are in two distinct species, let's call them ''species A'' and ''species B''. At time t = 0, the scientists measure and estimate the amount of species A and species B present in the puddle. They then proceed to measure and record the number of each species of paramecium present every hour for 12 days. the data for each species were then fit by a smooth curve, as shown in the graph above. Which of the following is a correct statement about the data above?AAt time t = 0, the number species B present is 150% greater than the number of species A presentBAt time t = 0, the number of species A present is 75% less than the number of species B presentCFor the first 3 days, the average growth rate of species B is higher than the average growth rate of species A.DThe growth rate of both rate of both species A and species B decreases for the last 8 days.The given Bar Graph presents a country's exports (in million rupees) during 2015-2018, and the Table the follows shows the break-up of goods exported in a year.

Break-Up of Goods Exported in a Year

What is the ratio of the total exports of computers in 2015 and 2017 to the total exports of cosmetics in 2015 and 2018 ?A27:20B36:25C3:2D8:5
Use the correct form of the word given in the bracket and fill in the blanks. One has been done for you.
His behaviour was disappointing. I expected him to be more polite. People present there were disappointed. (disappoint)
I met an ___________ person in the party. He was ___________ in tasting each and every dish kept in the food counter. (interest)
View SolutionDr. John is a botanist , he is experimenting with exotic species of rose plant Rose polyantha . He started with 40 plants, after a year 22 more plants were added thought reproduction but also 14 plants died during the experimentation .
Which of the following statements are correct ?
1. The death rate is 0.35% per year
2. The birth rate is 0.55 % per rose per year
3. The birth rate is 0.55 % per year
4. The death rate is 0.35 % per rose per year
View SolutionGive a reason for each of the following .
(a) The voices of two people talking at the same pitch and loudness sound different.
(b) The strings present in a guitar are of varying thicknesses.
(c) The time period of a simple pendulum of string length 0.5 m remains the same even when its amplitude is halved, doubled or tripled.
View SolutionAdriana used the data from a scatterplot she found on the U.S. Census Bureau's website to determine a regression model showing the relationship between the population in the area where she lived and the number of years, x, after she was born. The result was an exponential growth equation of the form y=x0(1+r)x. Which of the following does x0 most likely represent in the equation ?
View SolutionDr. John is a botanist , he is experimenting with exotic species of rose plant Rose polyantha . He started with 40 plants, after a year 22 more plants were added thought reproduction but also 14 plants died during the experimentation .
Which of the following statements are correct ?
1. The death rate is 0.35% per year
2. The birth rate is 0.55 % per rose per year
3. The birth rate is 0.55 % per year
4. The death rate is 0.35 % per rose per year
View Solution
